Feature Description
Setting the stage
SMAP grm’s key function is to analyze pairwise genetic similarity, or conversely, the loci that discriminate between a set of samples based on a genotype table.
Haplotype call table
SMAP grm specifically works on the haplotype call table created by SMAP haplotype-sites or SMAP haplotype-window. Haplotype calls in the table can be discrete (e.g. 0, 1 or 2) for individuals, or haplotype frequencies (value from 0 to 1) for pool-Seq data. This haplotype call table lists the absence and presence of haplotypes as multi-allelic markers for a given set of loci, across a given set of samples. The haplotype call table is the only input required to run the script.
Genetic distance
Genetic distance may be calculated in different ways, but is essentially based on the proportion of shared haplotypes over all observed haplotypes. A pair of samples that contain only the same haplotypes (across all loci), have a distance of 0 and a similarity of 1. A pair of samples that each contain unique haplotypes that the other sample does not contain (across all loci), have a distance of 1 and a similarity of 0. Clearly, genetic distance can only be calculated if samples both have data at the same sets of loci, otherwise their haplotypes can not be compared.
The difference between “Shared loci” and “Shared or Unique haplotypes”
It is important to understand the clear distinction between these definitions:
Shared loci: Loci that have a call of at least one haplotype in each of two samples in a pair are called ‘shared loci’ (loci with data in a sample pair). Loci with missing data are excluded. Given a pair of samples with a shared locus, haplotypes can be compared.
Unique haplotype: a haplotype that occurs in one sample but not in the other, is defined as a “Unique haplotype”. Shared haplotype: a haplotype that occurs in both samples of a pair, is defined as a “Shared haplotype”.
Note that Unique and Shared haplotypes can only be evaluated in shared loci (with data in both samples). Then, there are two ways in which similarities and/or discriminatory loci are calculated, based either on Shared or Unique haplotypes directly (like Jaccard Distance), or by aggregating on “loci that contain Shared or Unique haplotypes”.
To clarify the concepts and definitions, check out the scheme and explanation below.
Reference
Locus
Haplotypes
Sample1
Sample2
Sample3
Chrom1
A
00
0
0
1
Chrom1
A
10
1
1
0
Chrom1
B
000
1
Chrom1
B
100
0
Chrom1
C
00
1
1
Chrom1
C
11
0
1
Shared loci:
locusA: is a Shared locus in all pairs of samples.
locusB: is never a Shared locus, data is missing in two out of three samples, no pairs with data
locusC: is only a Shared locus in the pair Sample1-Sample3.
Unique haplotypes:
locusA: in pair Sample1-Sample2, there are no Unique haplotypes. in pair Sample1-Sample3, there are two Unique haplotypes: haplotype 00 is Unique for Sample3, haplotype 10 is Unique for Sample1. The same score applies to pair Sample2-Sample3.
locusB: haplotypes can not be evaluated, as it is not a Shared locus in any of the sample pairs.
locusC: haplotype 11 is Unique for Sample3 (but in heterozygous state with the Shared haplotype 00 in Sample3).
Shared haplotypes:
locusA: in pair Sample1-Sample2, there are two Shared haplotypes (00 and 10). in pair Sample1-Sample3, there are no Shared haplotypes. in pair Sample2-Sample3, there are no Shared haplotypes.
locusB: haplotypes can not be evaluated, as it is not a Shared locus in any of the sample pairs.
locusC: haplotype 00 is shared between Sample1 and Sample3.
Jaccard Distance
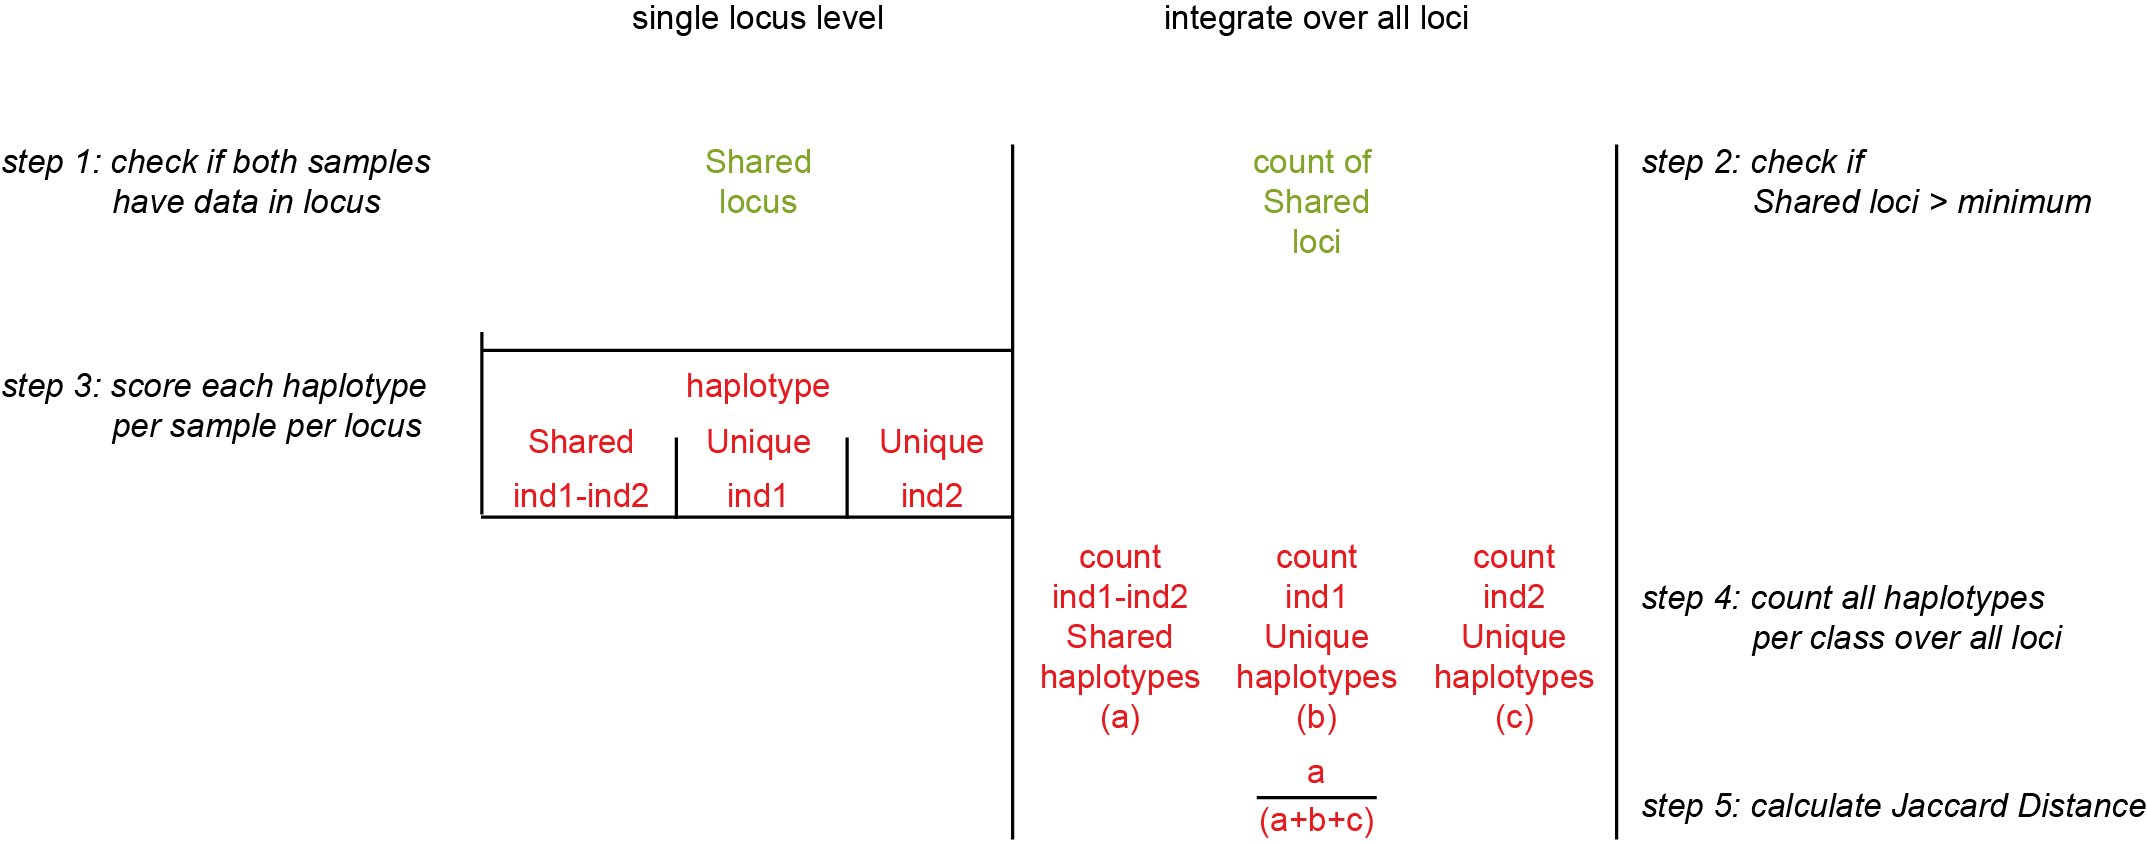
The Jaccard Distance counts the number of shared loci per pair and divides that by the sum of (Unique haplotypes for Sample1 + Unique haplotypes for Sample2 + Shared haplotypes).
For example in pair Sample1-Sample3:
Shared Haplotypes: locusA (0) + locusC (1) = 1 (a)
Unique Haplotypes Sample1: locusA (1) + locusC (0) = 1 (b)
Unique Haplotypes Sample2: locusA (1) + locusC (1) = 2 (c)
Jaccard = a/(a+b+c) = 1/(1+1+2) = 1/4 = 0.25
Information content of loci with Shared or Unique haplotypes
SMAP grm can also evaluate (dis)similarities at the level of the locus, which has great value for:
delineating loci with unique haplotypes per sample (diagnostic identification markers, e.g. cultivar detection)
identifying pairs of individals with (near-)completely identical haplotype sets (e.g. clones)
identifying pairs of individals with (near-)complete sets of loci with at least one haplotype shared per locus (e.g. parent-progeny pairs)
To fit these purposes, SMAP grm uses two optional parameters to define how loci are scored, based on the number of Unique and Shared haplotypes per locus in a sample pair: --locus_information_criterion and --partial.
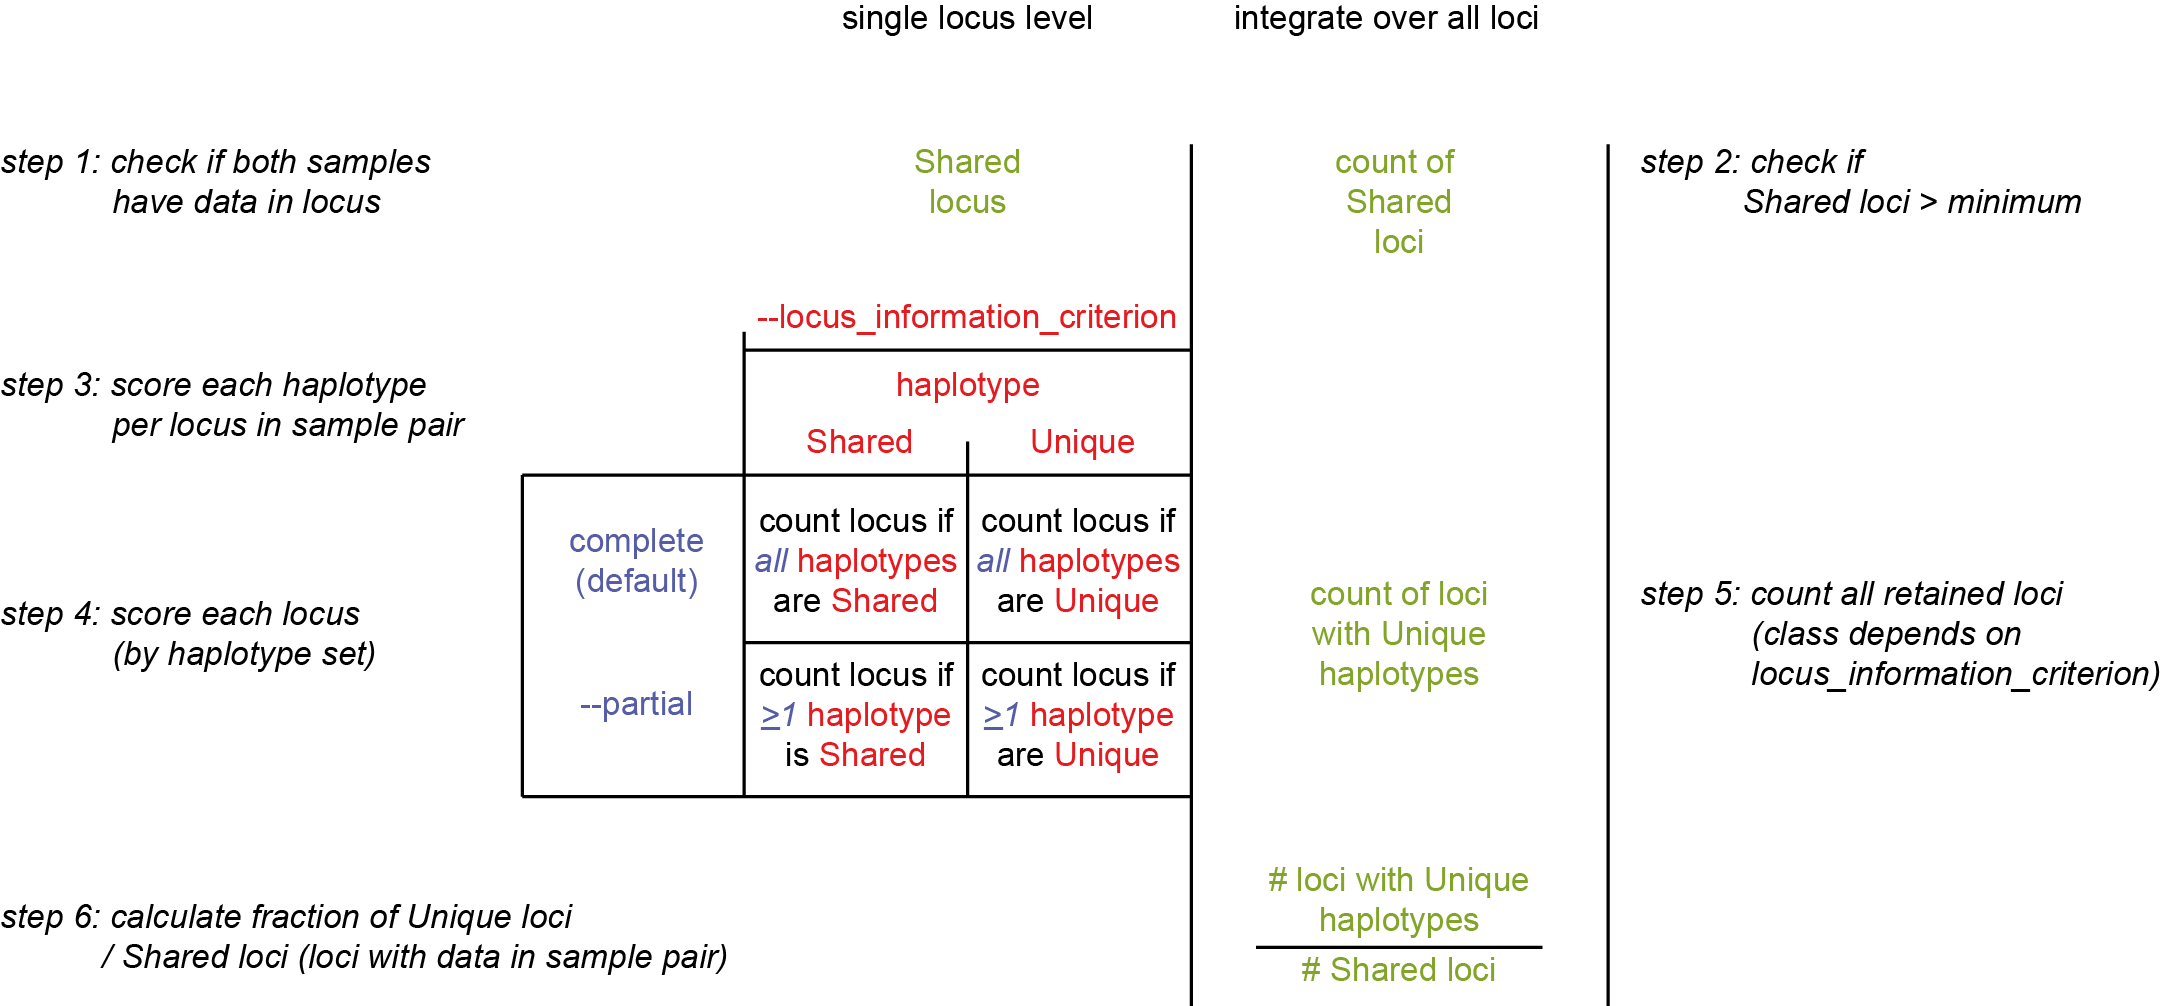
In the scheme above, note how the two different optional parameters --locus_information_criterion (indicated in red) and --partial (indicated in blue) control which loci are counted, depending on whether they have Shared or Unique haplotypes, and whether all haplotypes are Unique or Shared per locus (complete), or that only a part of the haplotypes are Unique or Shared (partial).
counts across all loci are indicated in green
counts at the level of haplotype (Unique / Shared haplotypes) are indicated in red
whether loci contain only Shared or Unique (complete) or part of the haplotype set per locus is Shared or Unique (partial) is indicated in blue
So, combining --locus_information_criterion and --partial creates four scenario’s for counting loci based on their constituent haplotypes:
Complete Unique: all haplotypes observed per locus are Unique. This means that if one of those haplotypes is observed, it can uniquely be assigned to that sample (of the pair). All haplotypes of this locus contain discriminatory information to distinguish the samples. For instance, in parent-progeny testing, a locus set that only contains loci with Complete Unique haplotypes, can always be used to confirm a F1 progeny plant, as the F1 individual will always receive one Unique haplotype (allele) from one parent and one other Unique haplotype (allele) from the other parent. Designing a molecular marker set would benefit from enriching for loci with high discriminative power, and running SMAP grm in Complete Unique mode helps to identify such loci.
Partial Unique: at least one haplotypes observed per locus is Unique for the sample pair. This means that if the Unique haplotype is observed, that haplotype can be assigned to the ‘donor’ sample. However, some of the haplotypes are also Shared and if those are detected, the haplotype can not be assigned to a specific sample of the pair, limiting discriminatory power.
Complete Shared: all haplotypes observed per locus are Shared. This means that the genotypes in the sample pair are genetically identical (at least at the loci screened). For instance, running SMAP grm on a sample set that may contain clonal material (i.e. with many loci expected to contain identical haplotypes in pairs of samples), will identify clones as having near-100% of the Complete Shared loci counted.
Partial Shared: at least one of the haplotypes observed per locus is Shared between the sample pair. When many (if not all) loci show Partially Shared haplotypes, then the two samples may be directly related, perhaps siblings or parent-progeny. A parental pair with many Complete Unique loci will pass on parent-specific Unique haplotypes (alleles) to its progeny. This also means that on all loci observed in the progeny, one may expect to find at least one Unique haplotype from parent1 and also one Unique haplotype from parent2. In other words, in pairwise parent-progeny pairs that locus is expected to show Partially Shared haplotypes (only one allele is shared each time with one of the parents, the other can not match because all alleles are parent-specific). A triplet of two parents (with many loci with Completely Unique haplotypes and very few loci with Partially Shared haplotypes), and a progeny with near-100% of loci with Partially Shared haplotypes with both parents is expected. So, parental testing is implemented by first running SMAP grm on genetic diversity data of parental lines and defining loci with Complete Unique haplotypes, and then running SMAP grm on the genotyping matrix of parents and progeny looking for loci with Partially Shared haplotypes to identify parent-progeny pairs.
Loci with Complete Unique haplotypes
To illustrate the different kinds of analyses that can be performed, a simulated haplotype call matrix was created that includes various scenarios of shared and unique haplotype calls across a small sample set.
--locus_information_criterion unique (which creates a matrix showing the number of loci with unique haplotypes in each comparison e.g. locus5 in ind7 uniquely has haplotype d) and only loci with all unique haplotypes are counted (complete, default)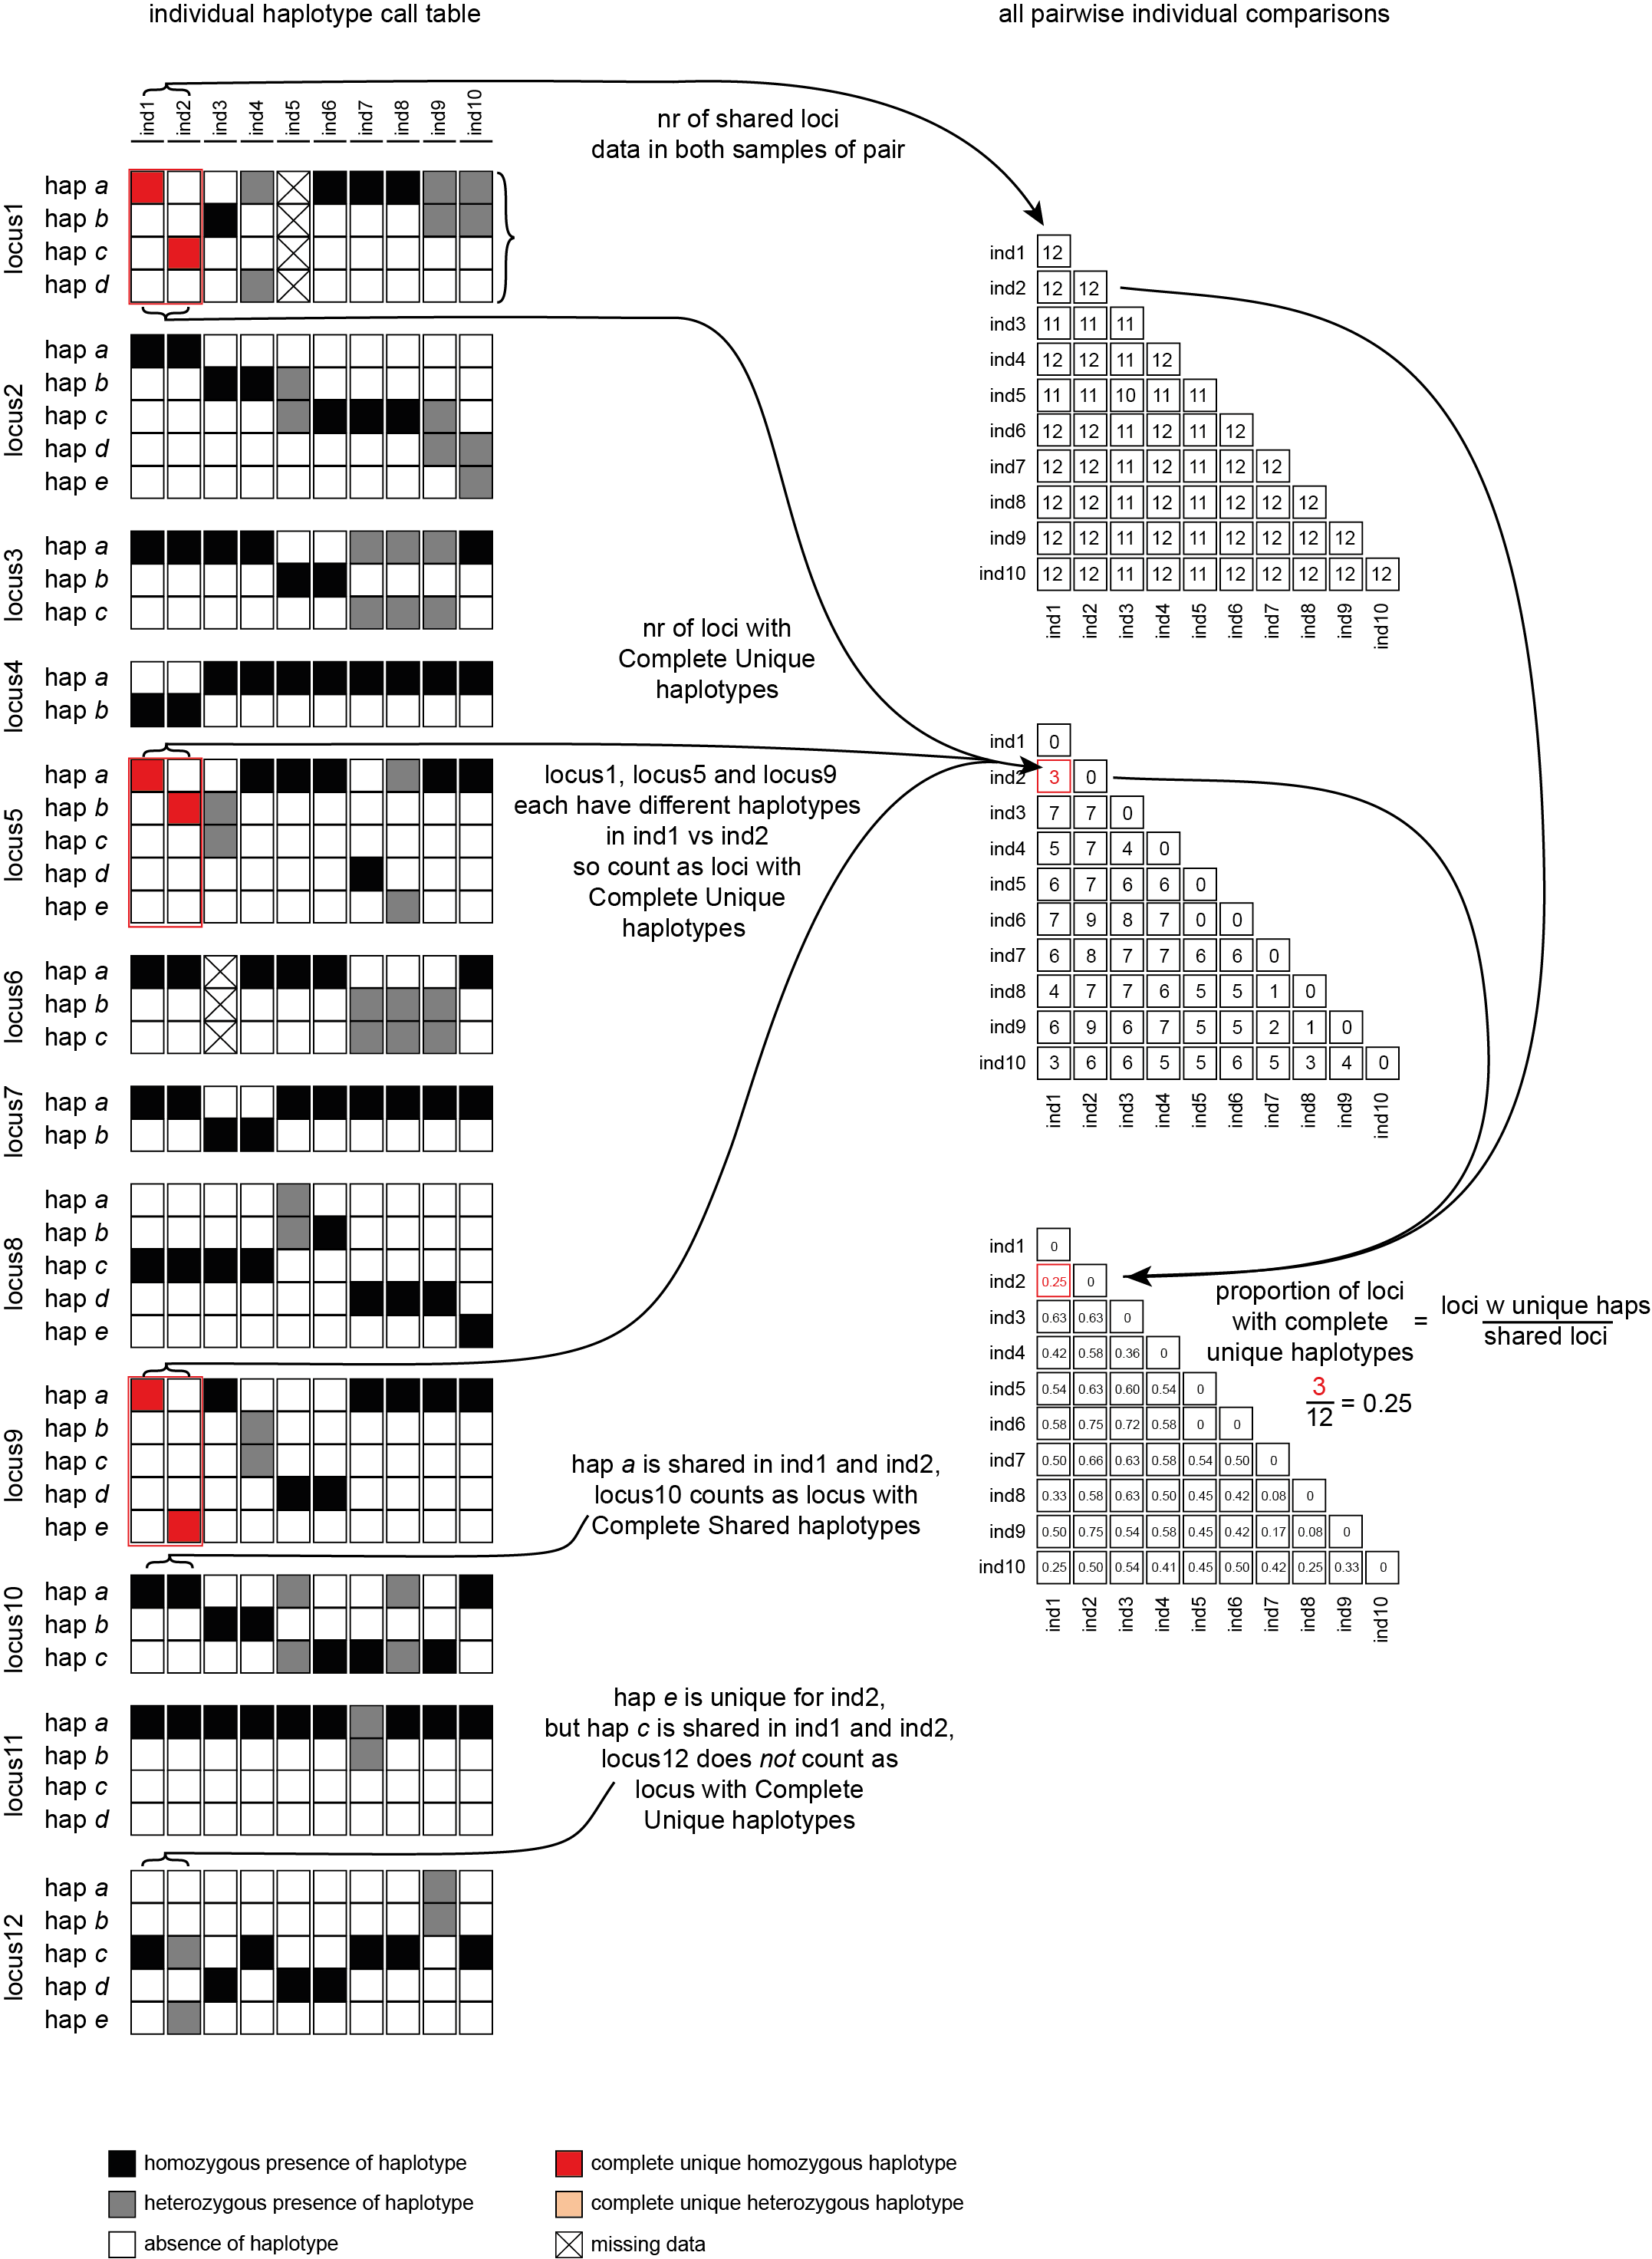
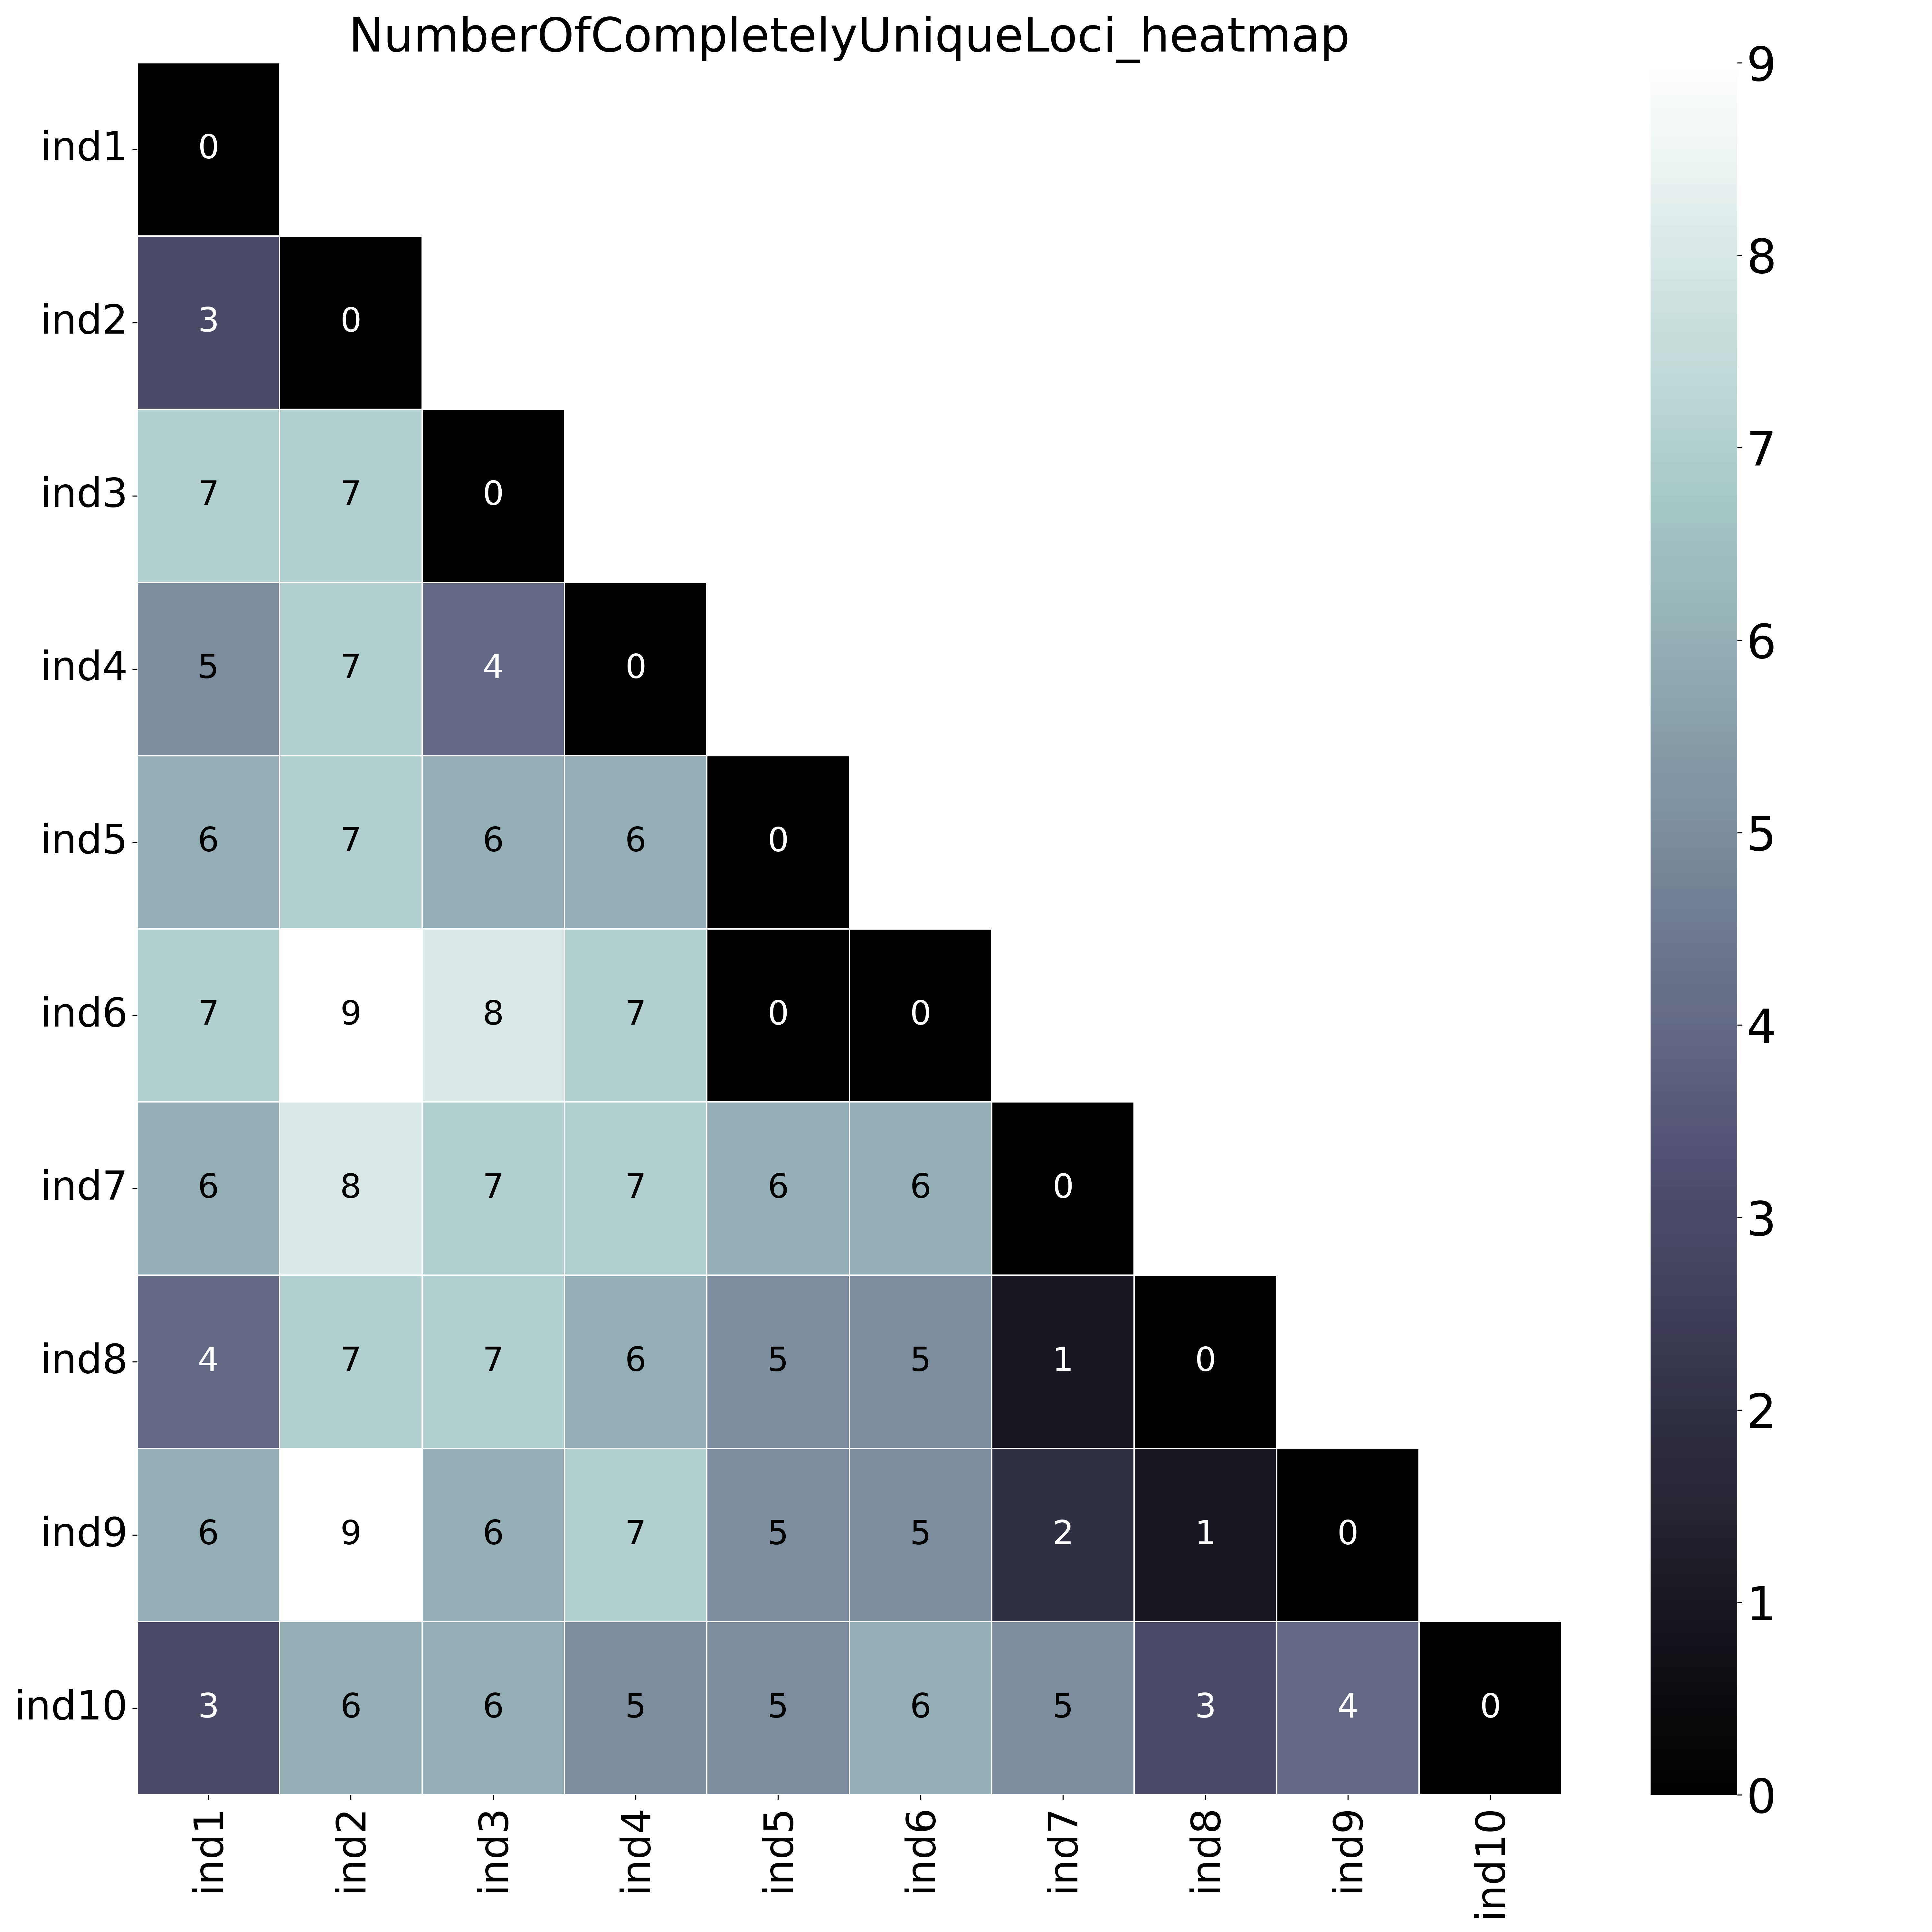
--locus_information_criterion unique.This table (NumberOfCompletelyUniqueLoci.txt) shows the (absolute) number of loci with Complete Unique haplotypes per sample pair, in a matrix of all pairwise comparisons.
ind1
ind2
ind3
ind4
ind5
ind6
ind7
ind8
ind9
ind10
ind1
0
ind2
3
0
ind3
7
7
0
ind4
5
7
4
0
ind5
6
7
6
6
0
ind6
7
9
8
7
0
0
ind7
6
8
7
7
6
6
0
ind8
4
7
7
6
5
5
1
0
ind9
6
9
6
7
5
5
2
1
0
ind10
3
6
6
5
5
6
5
3
4
0
With option--proportion_informative_loci, table (ProportionOfCompletelyUniqueLoci.txt) lists the proportion of the number of shared loci per sample pair (loci with data in both samples).
ind1
ind2
ind3
ind4
ind5
ind6
ind7
ind8
ind9
ind10
ind1
0.0
ind2
0.25
0.0
ind3
0.6363636363636364
0.6363636363636364
0.0
ind4
0.4166666666666667
0.5833333333333334
0.36363636363636365
0.0
ind5
0.5454545454545454
0.6363636363636364
0.6
0.5454545454545454
0.0
ind6
0.5833333333333334
0.75
0.7272727272727273
0.5833333333333334
0.0
0.0
ind7
0.5
0.6666666666666666
0.6363636363636364
0.5833333333333334
0.5454545454545454
0.5
0.0
ind8
0.3333333333333333
0.5833333333333334
0.6363636363636364
0.5
0.45454545454545453
0.4166666666666667
0.08333333333333333
0.0
ind9
0.5
0.75
0.5454545454545454
0.5833333333333334
0.45454545454545453
0.4166666666666667
0.16666666666666666
0.08333333333333333
0.0
ind10
0.25
0.5
0.5454545454545454
0.4166666666666667
0.45454545454545453
0.5
0.4166666666666667
0.25
0.3333333333333333
0.0
 With option
--proportion_informative_loci, the heatmap shows the proportion of the number of shared loci per sample pair (loci with data in both samples).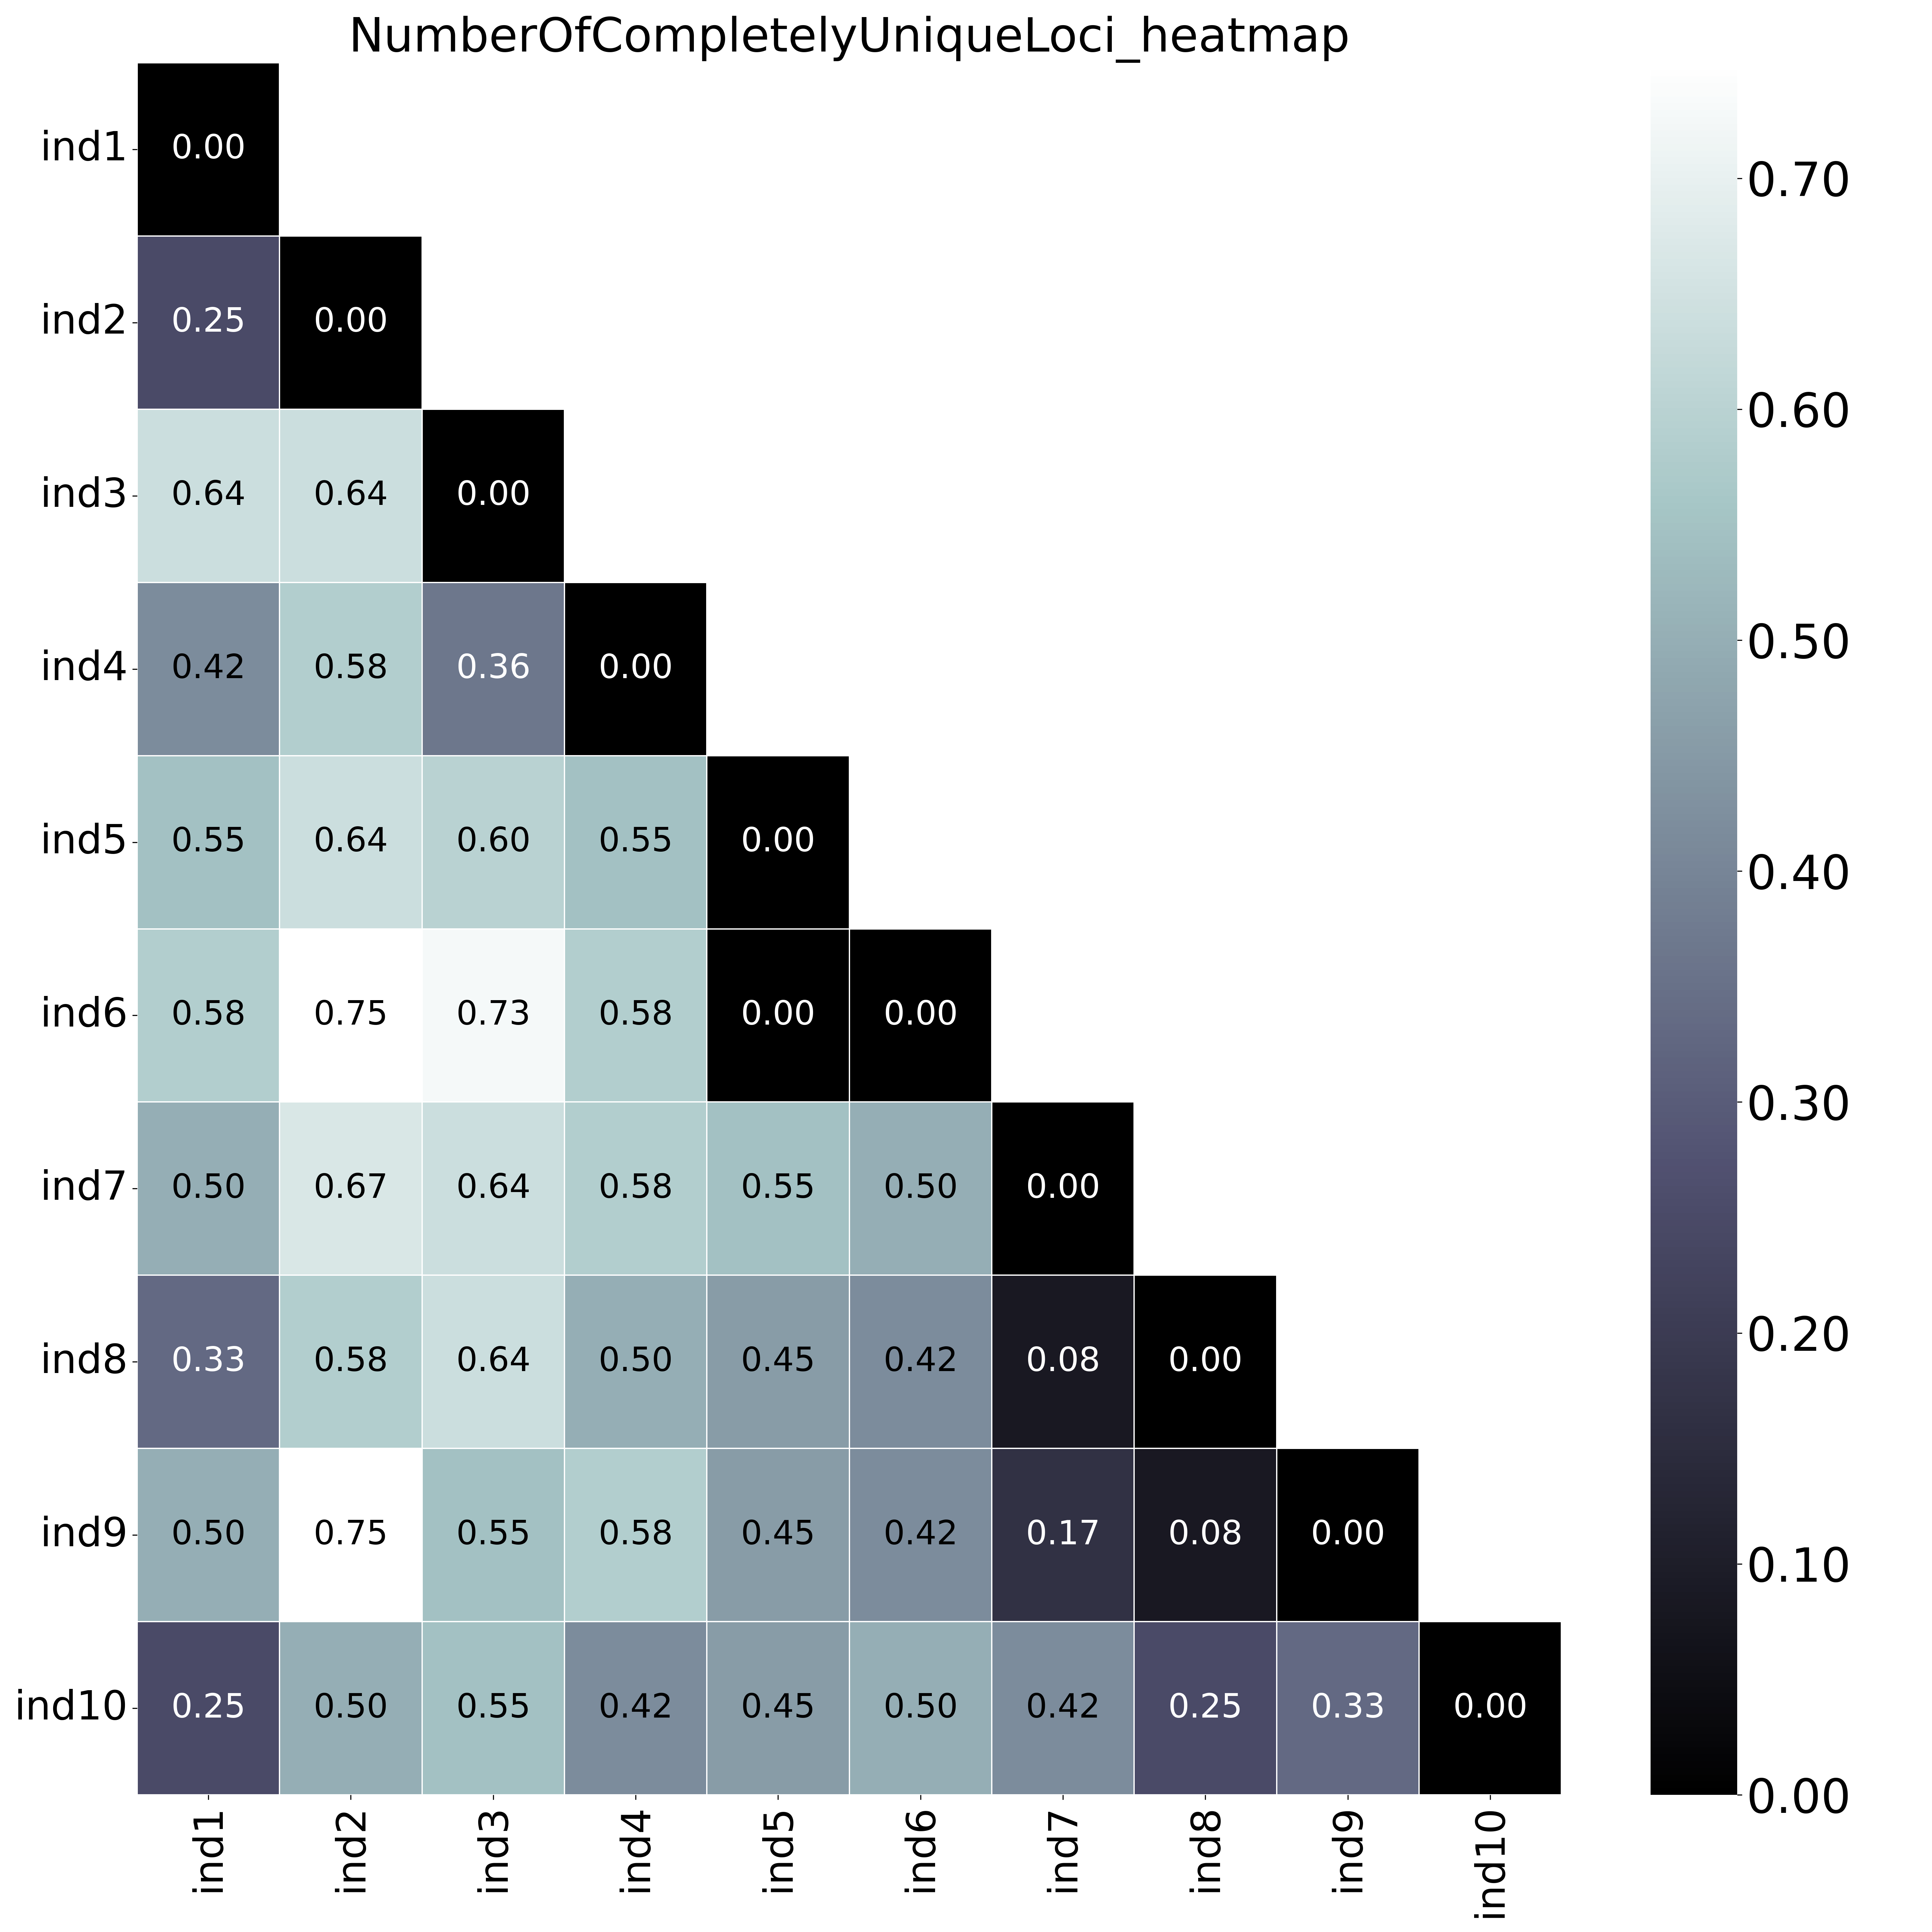 The font name and size of different elements in the graphs are changed with options
--font,--title_fontsize,--label_fontsize,--tick_fontsize, and--legend_fontsize. The legend position and resolution of the plot are adjusted with the options--legend_positionand--plot_resolution. Customize the colour scale in the matrices with the option--colour_map. Use option--maskto mask one half of the matrix (either all elements above the main diagonal or all elements below the main diagonal).This table (NumberOfSharedLoci.txt) shows the number of loci with data in both samples per pair.
ind1
ind2
ind3
ind4
ind5
ind6
ind7
ind8
ind9
ind10
ind1
12
ind2
12
12
ind3
11
11
11
ind4
12
12
11
12
ind5
11
11
10
11
11
ind6
12
12
11
12
11
12
ind7
12
12
11
12
11
12
12
ind8
12
12
11
12
11
12
12
12
ind9
12
12
11
12
11
12
12
12
12
ind10
12
12
11
12
11
12
12
12
12
12
This table (CompletelyUniqueLoci.txt) shows a list of all loci included in the analyses, the total number of sample pairs for which the loci were considered, the number of sample pairs for which the loci were informative, and the proportion of sample pairs for which the loci were informative. If the
--locus_information_criterionis set to ‘unique’, the names of samples with a unique haplotype for the corresponding locus across all sample pairs are also listed in this file (last column).
Locus_ID
NumberOfComparisons
NumberOfComparisonsWithUniqueLocus
ProportionOfComparisonsWithUniqueLocus
SamplesWithUniqueHaplotypes
locus1
36
13
0.36
locus2
45
30
0.67
locus3
45
16
0.36
locus4
45
16
0.36
locus5
45
23
0.51
ind7
locus6
36
18
0.5
locus7
45
16
0.36
locus8
45
35
0.78
ind10
locus9
45
29
0.64
ind2, ind4
locus10
45
25
0.56
locus11
45
0
0.0
locus12
45
27
0.6
ind9
Loci with Partial Unique haplotypes
To illustrate the different kinds of analyses that can be performed, a simulated haplotype call matrix was created that includes various scenarios of shared and unique haplotype calls across a small sample set.
--locus_information_criterion unique (which creates a matrix showing the number of loci with unique haplotypes in each comparison e.g. locus5 in ind7 uniquely has haplotype d) and loci that contain at least one unique haplotype are counted (--partial).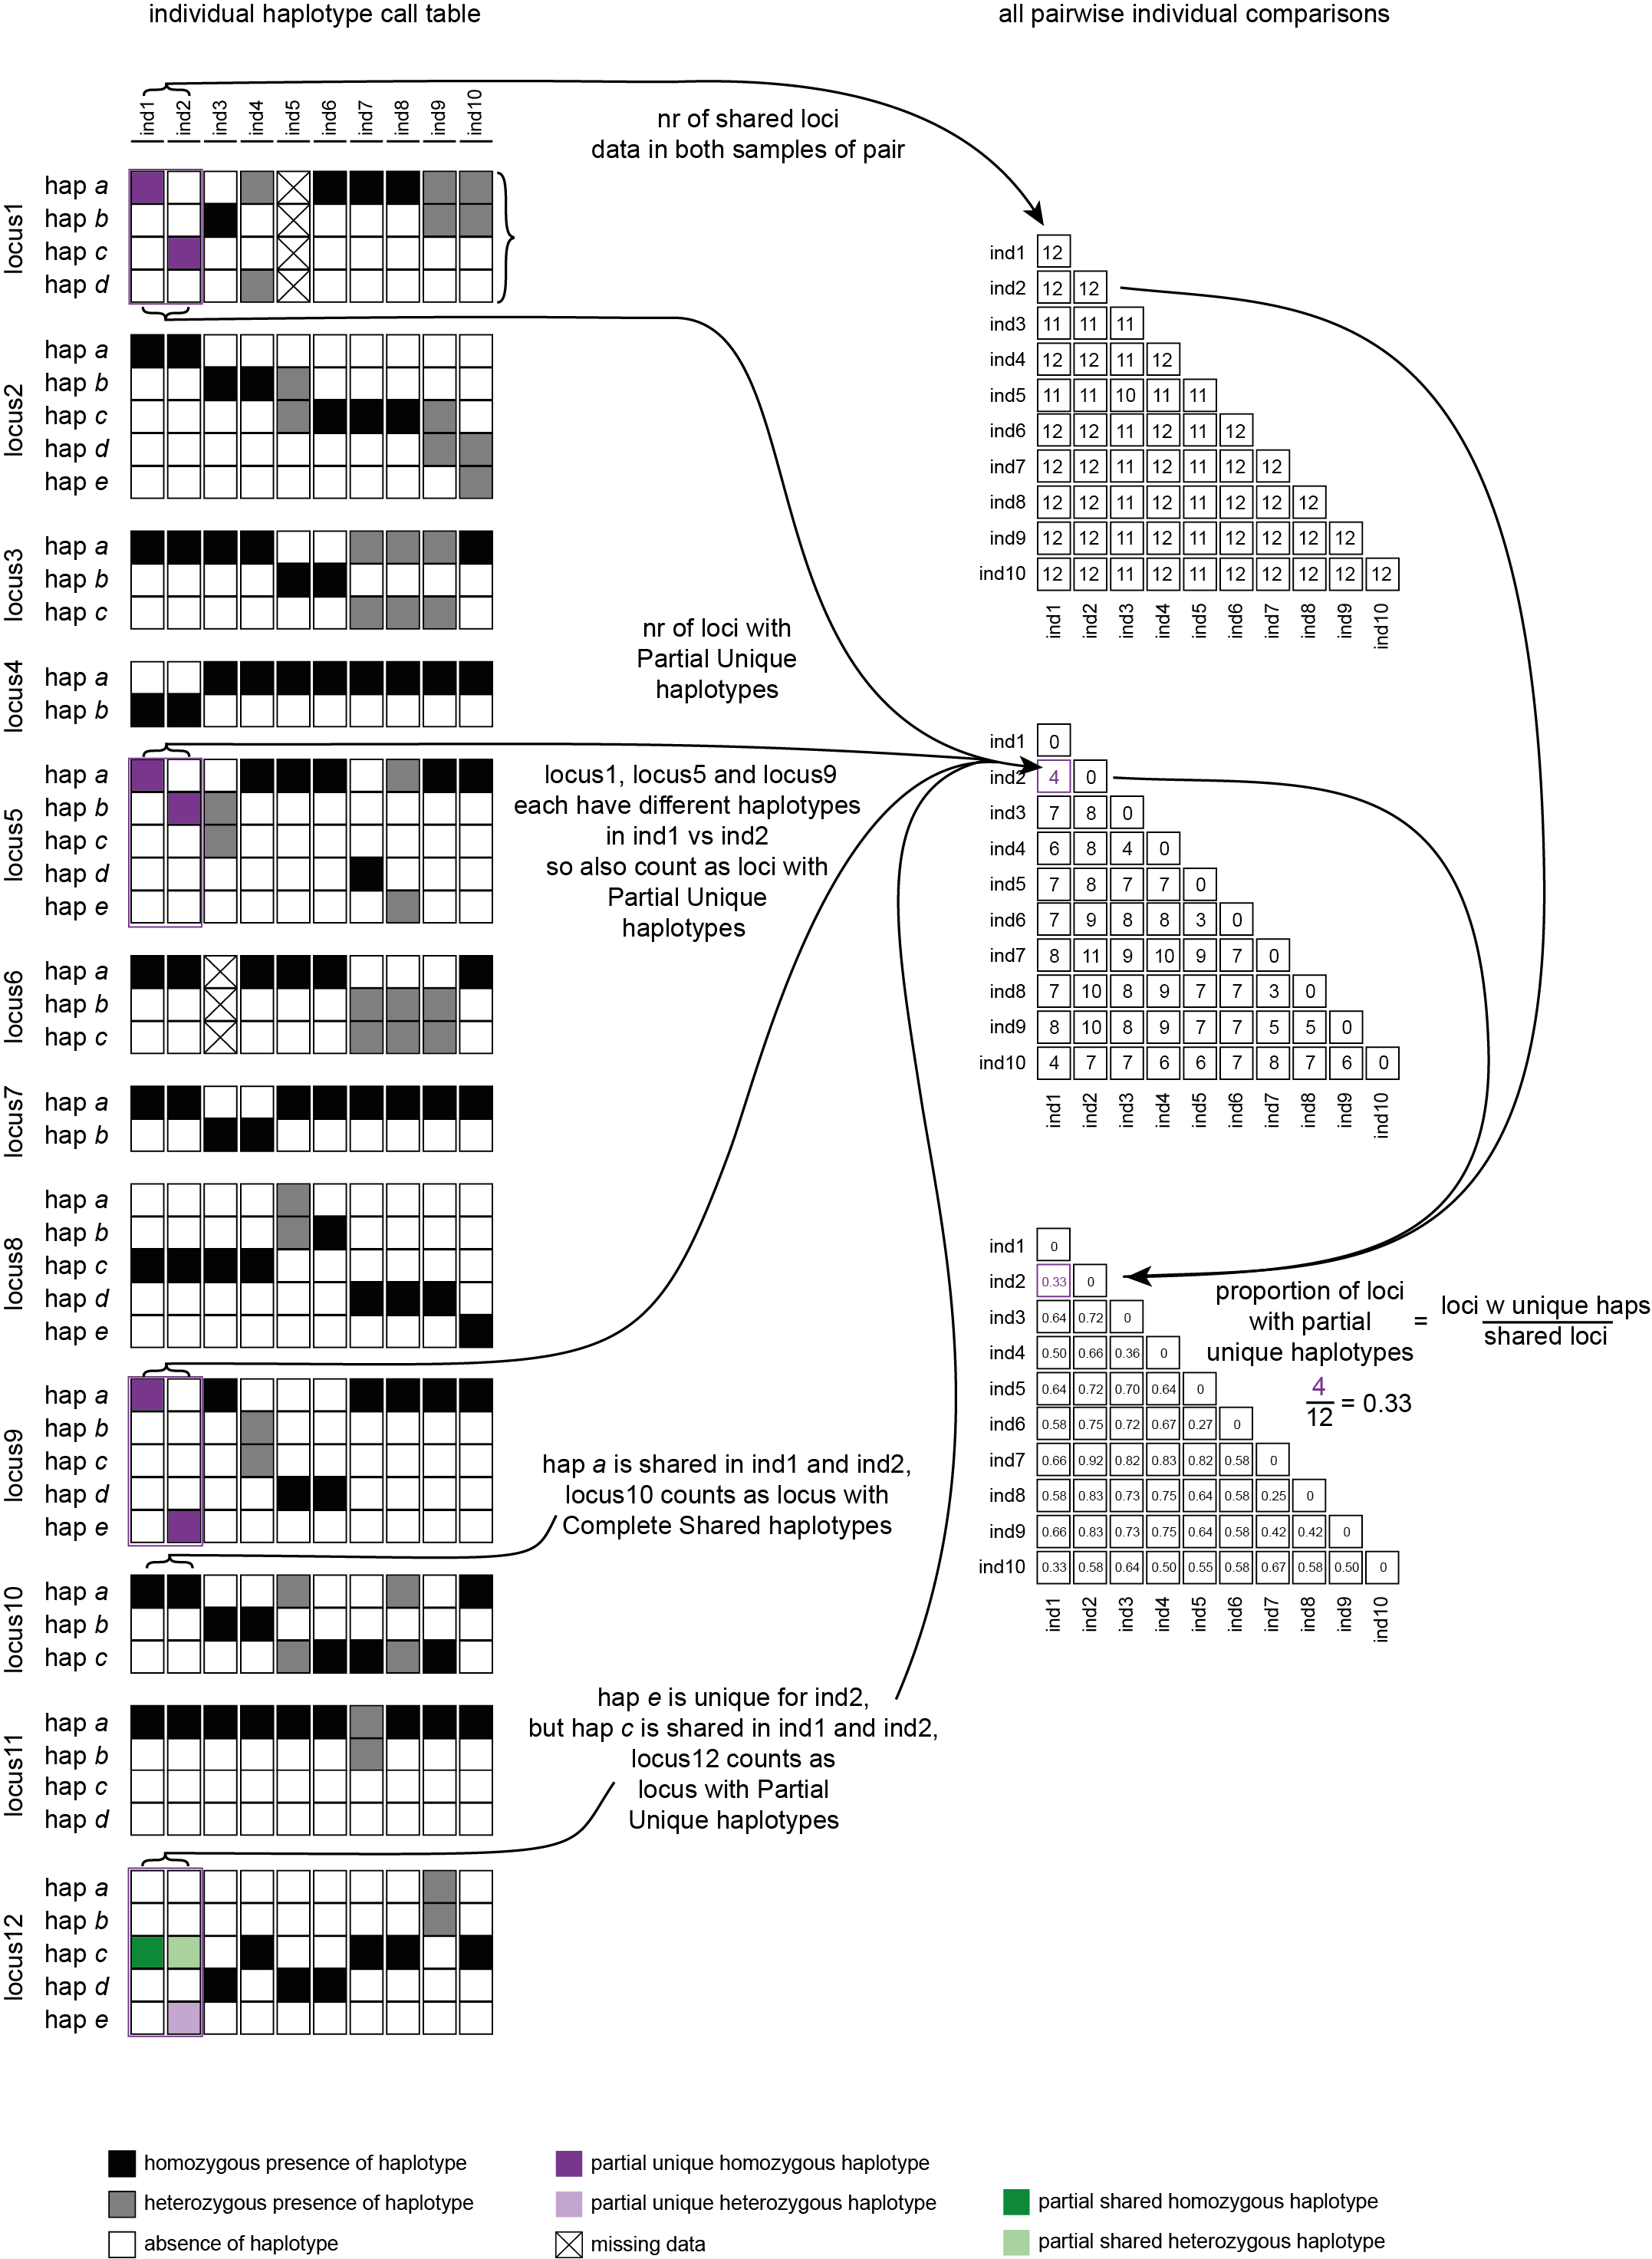
--locus_information_criterion unique.This table (NumberOfPartiallyUniqueLoci.txt) shows the (absolute) number of loci with Partial Unique haplotypes per sample pair, in a matrix of all pairwise comparisons.
ind1
ind2
ind3
ind4
ind5
ind6
ind7
ind8
ind9
ind10
ind1
0
ind2
4
0
ind3
7
8
0
ind4
6
8
4
0
ind5
7
8
7
7
0
ind6
7
9
8
8
3
0
ind7
8
11
9
10
9
7
0
ind8
7
10
8
9
7
7
3
0
ind9
8
10
8
9
7
7
5
5
0
ind10
4
7
7
6
6
7
8
7
6
0
With option--proportion_informative_loci, table (ProportionOfPartiallyUniqueLoci.txt) lists the proportion of the number of shared loci per sample pair (loci with data in both samples).
ind1
ind2
ind3
ind4
ind5
ind6
ind7
ind8
ind9
ind10
ind1
0.0
ind2
0.3333333333333333
0.0
ind3
0.6363636363636364
0.7272727272727273
0.0
ind4
0.5
0.6666666666666666
0.36363636363636365
0.0
ind5
0.6363636363636364
0.7272727272727273
0.7
0.6363636363636364
0.0
ind6
0.5833333333333334
0.75
0.7272727272727273
0.6666666666666666
0.2727272727272727
0.0
ind7
0.6666666666666666
0.9166666666666666
0.8181818181818182
0.8333333333333334
0.8181818181818182
0.5833333333333334
0.0
ind8
0.5833333333333334
0.8333333333333334
0.7272727272727273
0.75
0.6363636363636364
0.5833333333333334
0.25
0.0
ind9
0.6666666666666666
0.8333333333333334
0.7272727272727273
0.75
0.6363636363636364
0.5833333333333334
0.4166666666666667
0.4166666666666667
0.0
ind10
0.3333333333333333
0.5833333333333334
0.6363636363636364
0.5
0.5454545454545454
0.5833333333333334
0.6666666666666666
0.5833333333333334
0.5
0.0
 With option
--proportion_informative_loci, the heatmap shows the proportion of the number of shared loci per sample pair (loci with data in both samples).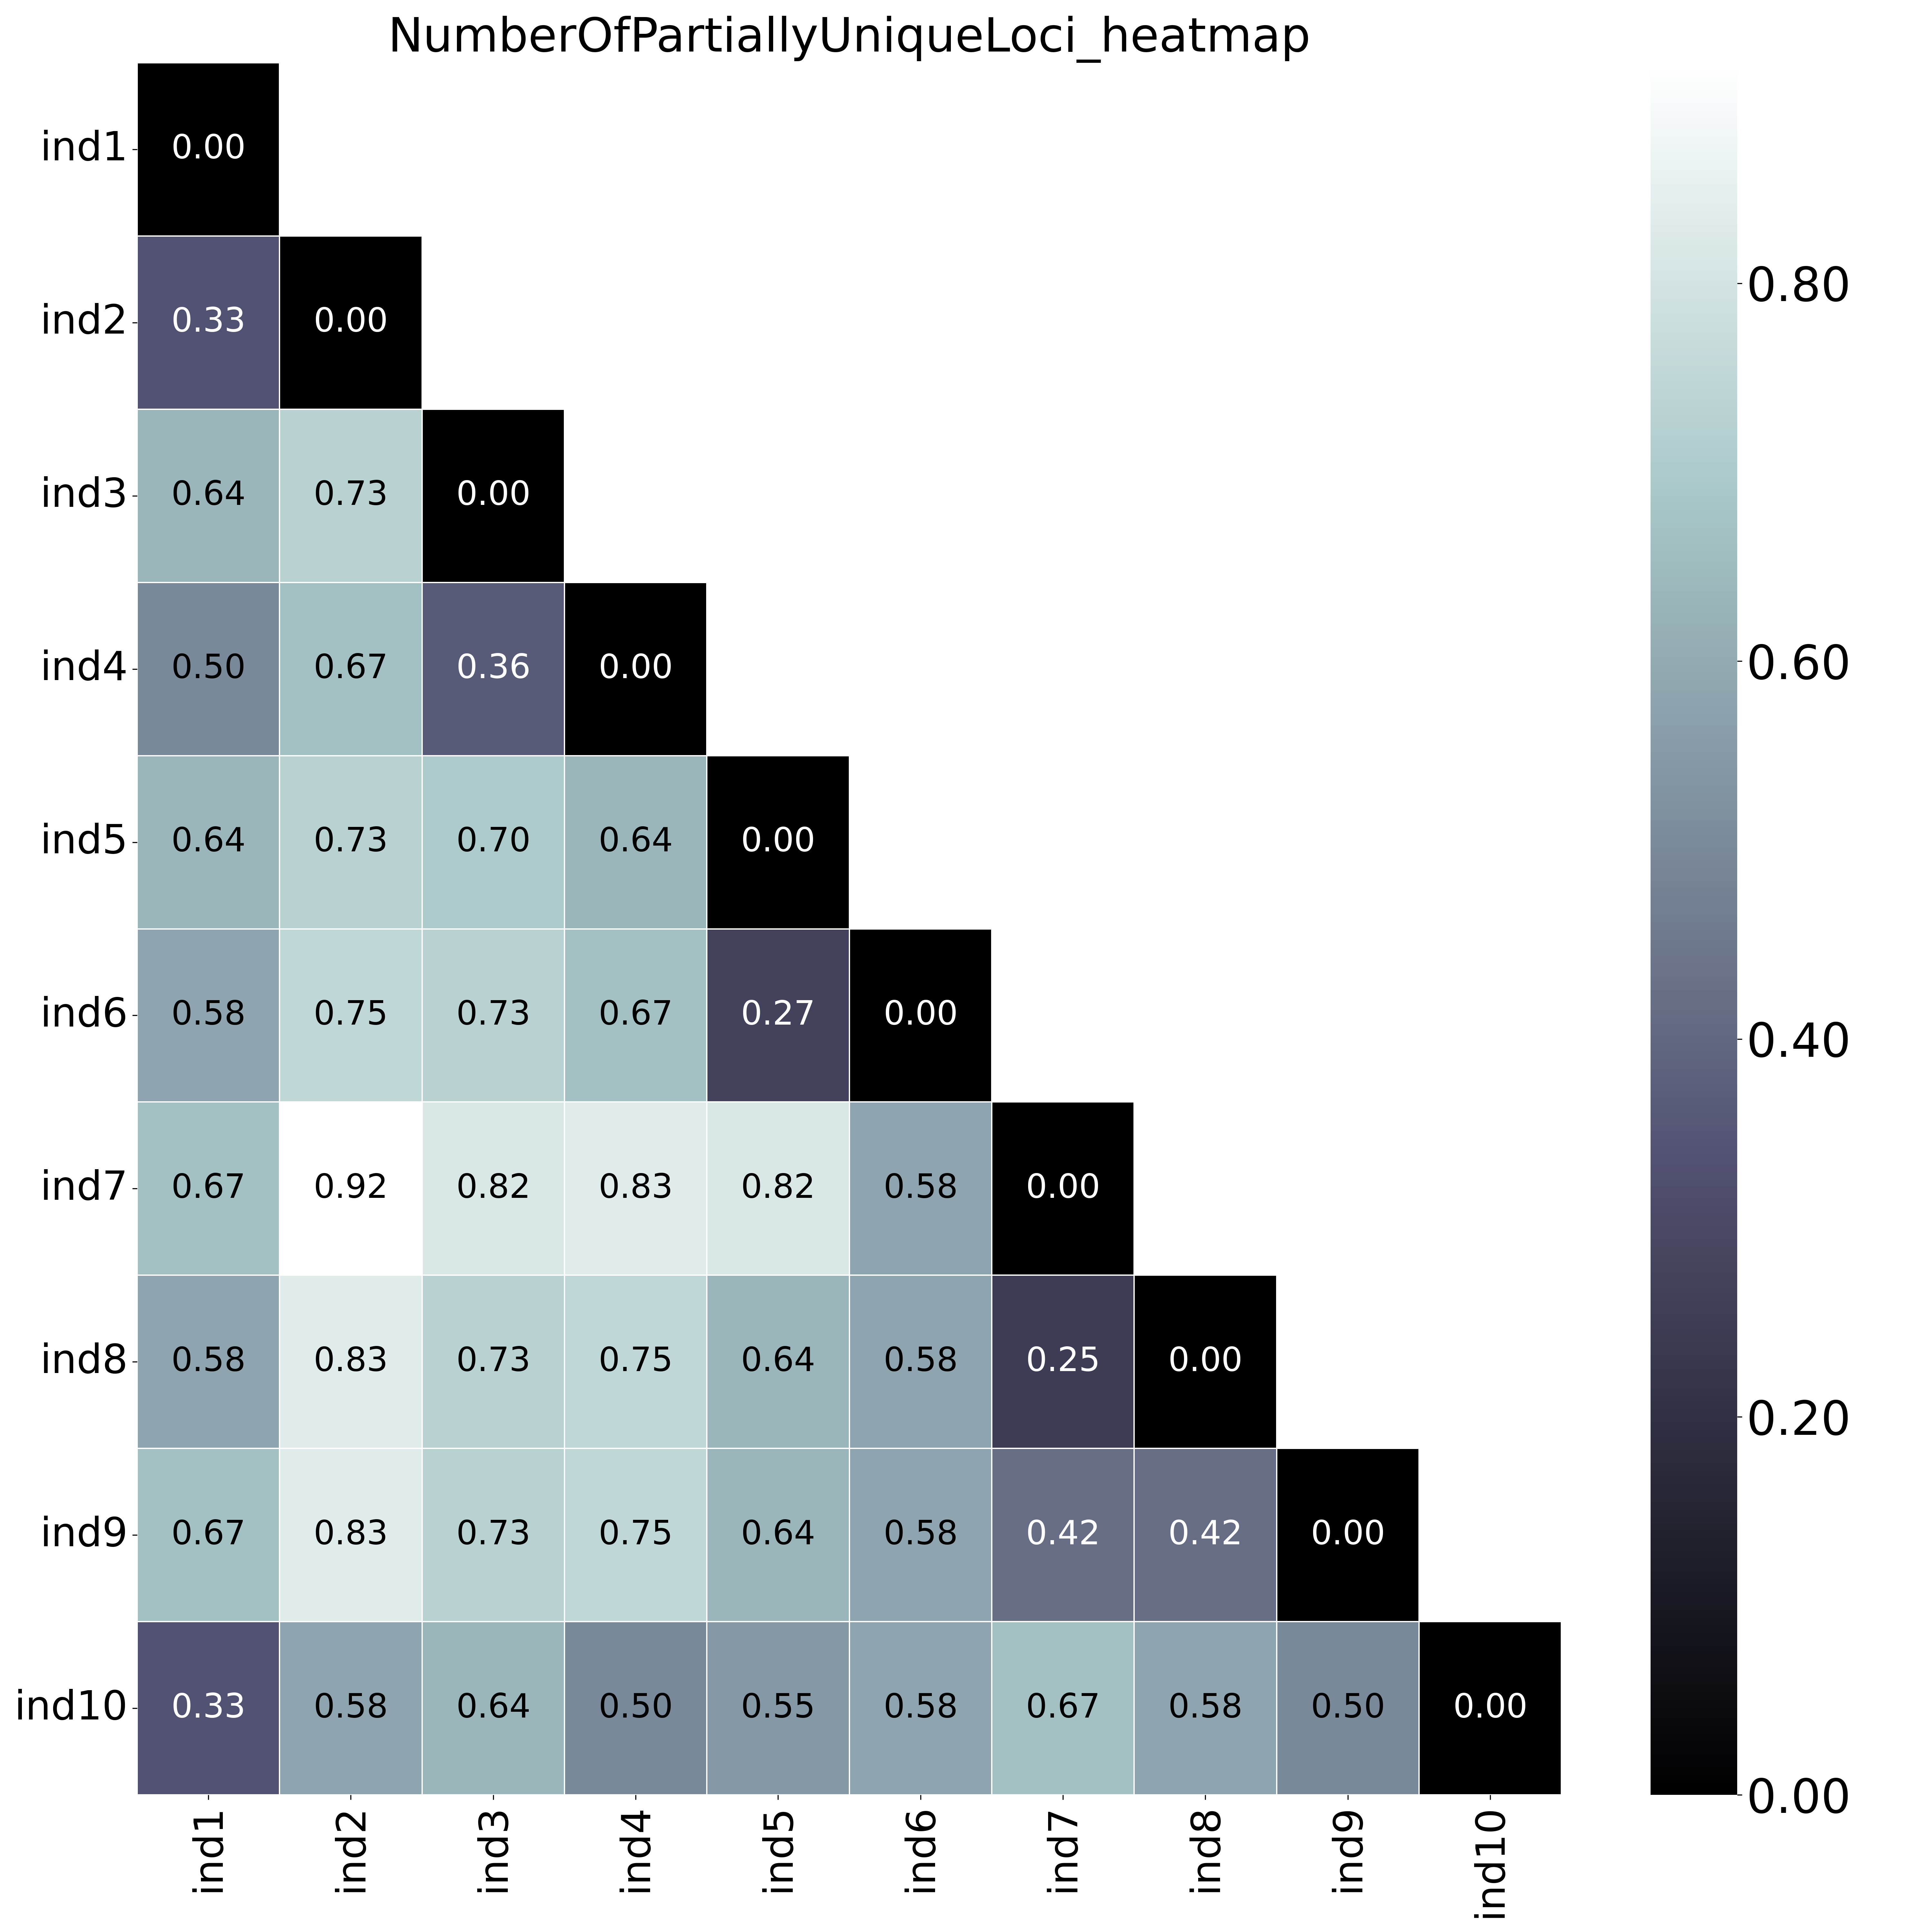 The font name and size of different elements in the graphs are changed with options
--font,--title_fontsize,--label_fontsize,--tick_fontsize, and--legend_fontsize. The legend position and resolution of the plot are adjusted with the options--legend_positionand--plot_resolution. Customize the colour scale in the matrices with the option--colour_map. Use option--maskto mask one half of the matrix (either all elements above the main diagonal or all elements below the main diagonal).This table (NumberOfSharedLoci.txt) shows the number of loci with data in both samples per pair.
ind1
ind2
ind3
ind4
ind5
ind6
ind7
ind8
ind9
ind10
ind1
12
ind2
12
12
ind3
11
11
11
ind4
12
12
11
12
ind5
11
11
10
11
11
ind6
12
12
11
12
11
12
ind7
12
12
11
12
11
12
12
ind8
12
12
11
12
11
12
12
12
ind9
12
12
11
12
11
12
12
12
12
ind10
12
12
11
12
11
12
12
12
12
12
This table (PartiallyUniqueLoci.txt) shows a list of all loci included in the analyses, the total number of sample pairs for which the loci were considered, the number of sample pairs for which the loci were informative (contain Partial Unique haplotypes), and the proportion of sample pairs for which the loci were informative. If the
--locus_information_criterionis set to ‘unique’, the names of samples with at least one unique haplotype for the corresponding locus across all sample pairs are also listed in this file (last column).
Locus_ID
NumberOfComparisons
NumberOfComparisonsWithUniqueLocus
ProportionOfComparisonsWithUniqueLocus
SamplesWithUniqueHaplotypes
locus1
36
29
0.81
locus2
45
40
0.89
ind5, ind9, ind10
locus3
45
31
0.69
locus4
45
16
0.36
locus5
45
30
0.67
ind2, ind3, ind7, ind8
locus6
36
18
0.5
locus7
45
16
0.36
locus8
45
36
0.8
ind5, ind6, ind10
locus9
45
29
0.64
ind2, ind4
locus10
45
37
0.82
locus11
45
9
0.2
ind7
locus12
45
32
0.71
ind2, ind9
Loci with Complete Shared haplotypes
To illustrate the different kinds of analyses that can be performed, a simulated haplotype call matrix was created that includes various scenarios of shared and unique haplotype calls across a small sample set.
--locus_information_criterion shared (which creates a matrix showing the number of loci with shared haplotypes in each comparison e.g. locusX in indY and indZ both have haplotype a and b) and only loci with all shared haplotypes are counted (complete, default)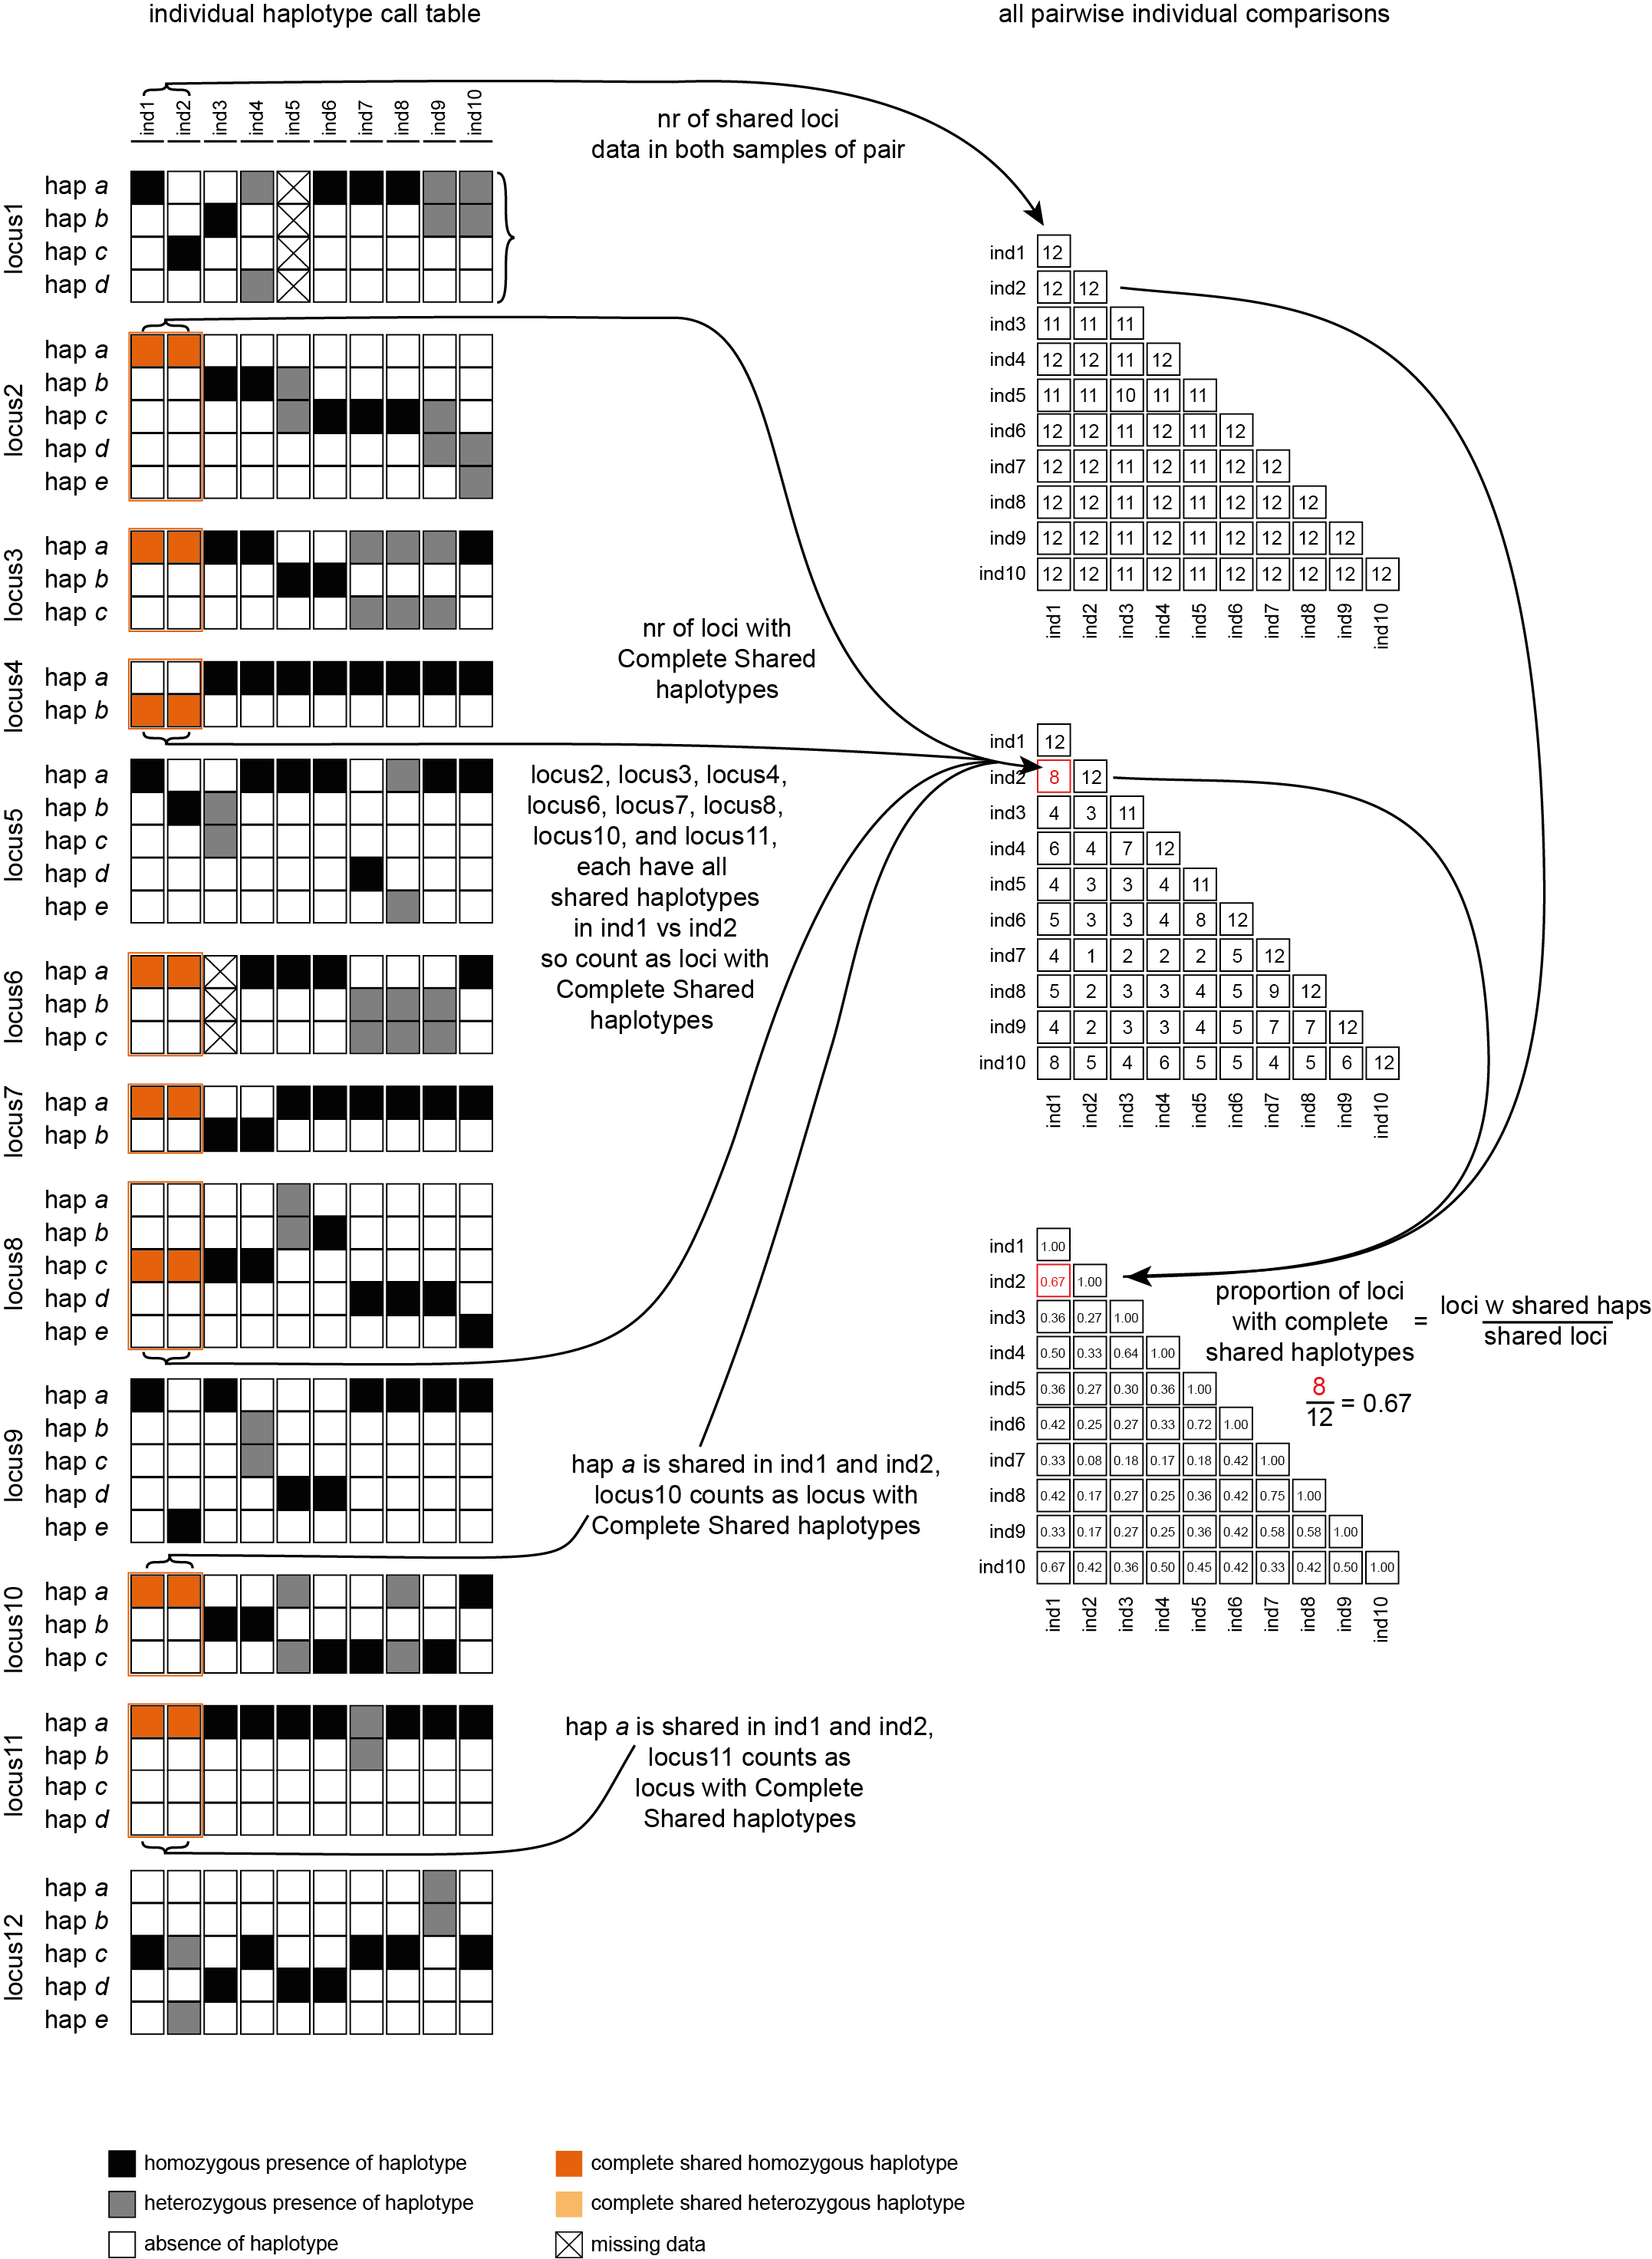
This table (NumberOfCompletelySharedLoci.txt) shows the (absolute) number of loci with Complete Shared haplotypes per sample pair, in a matrix of all pairwise comparisons.
ind1
ind2
ind3
ind4
ind5
ind6
ind7
ind8
ind9
ind10
ind1
12
ind2
8
12
ind3
4
3
11
ind4
6
4
7
12
ind5
4
3
3
4
11
ind6
5
3
3
4
8
12
ind7
4
1
2
2
2
5
12
ind8
5
2
3
3
4
5
9
12
ind9
4
2
3
3
4
5
7
7
12
ind10
8
5
4
6
5
5
4
5
6
12
With option--proportion_informative_loci, table (ProportionOfCompletelySharedLoci.txt) lists the proportion of the number of shared loci per sample pair (loci with data in both samples).
ind1
ind2
ind3
ind4
ind5
ind6
ind7
ind8
ind9
ind10
ind1
1.0
ind2
0.6666666666666666
1.0
ind3
0.36363636363636365
0.2727272727272727
1.0
ind4
0.5
0.3333333333333333
0.6363636363636364
1.0
ind5
0.36363636363636365
0.2727272727272727
0.3
0.36363636363636365
1.0
ind6
0.4166666666666667
0.25
0.2727272727272727
0.3333333333333333
0.7272727272727273
1.0
ind7
0.3333333333333333
0.08333333333333333
0.18181818181818182
0.16666666666666666
0.18181818181818182
0.4166666666666667
1.0
ind8
0.4166666666666667
0.16666666666666666
0.2727272727272727
0.25
0.36363636363636365
0.4166666666666667
0.75
1.0
ind9
0.3333333333333333
0.16666666666666666
0.2727272727272727
0.25
0.36363636363636365
0.4166666666666667
0.5833333333333334
0.5833333333333334
1.0
ind10
0.6666666666666666
0.4166666666666667
0.36363636363636365
0.5
0.45454545454545453
0.4166666666666667
0.3333333333333333
0.4166666666666667
0.5
1.0
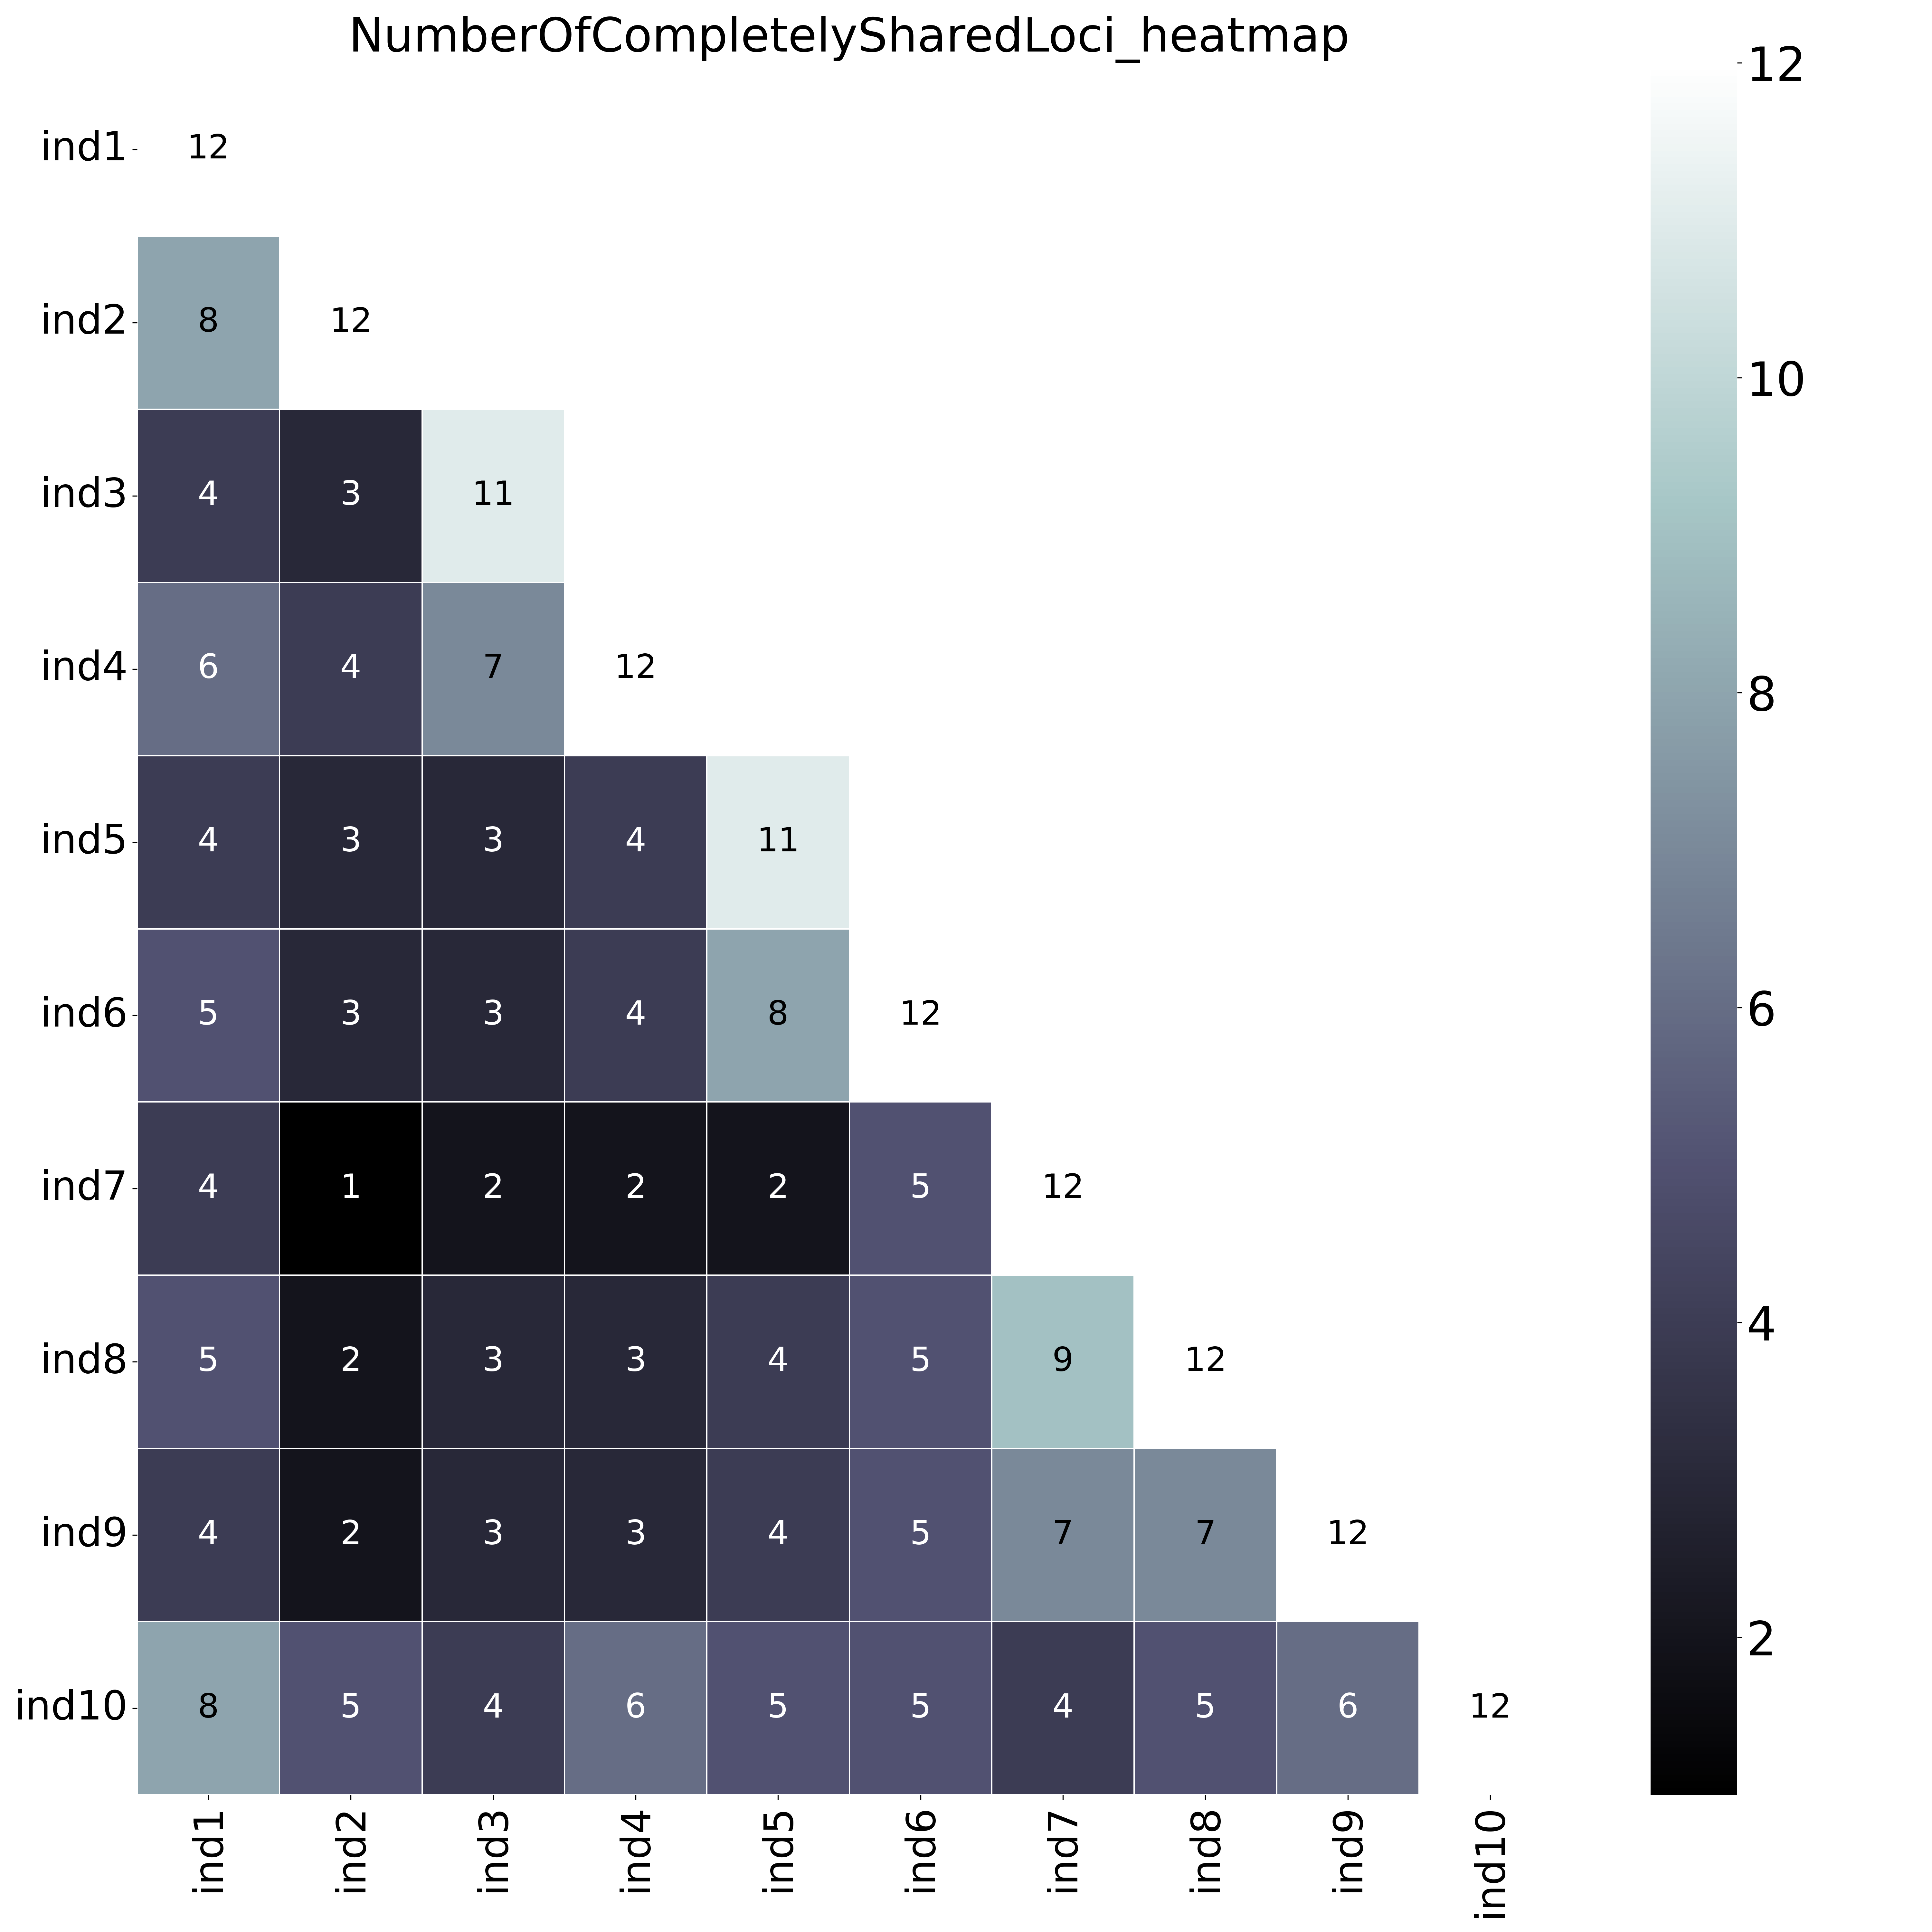 With option
--proportion_informative_loci, the heatmap shows the proportion of the number of shared loci per sample pair (loci with data in both samples).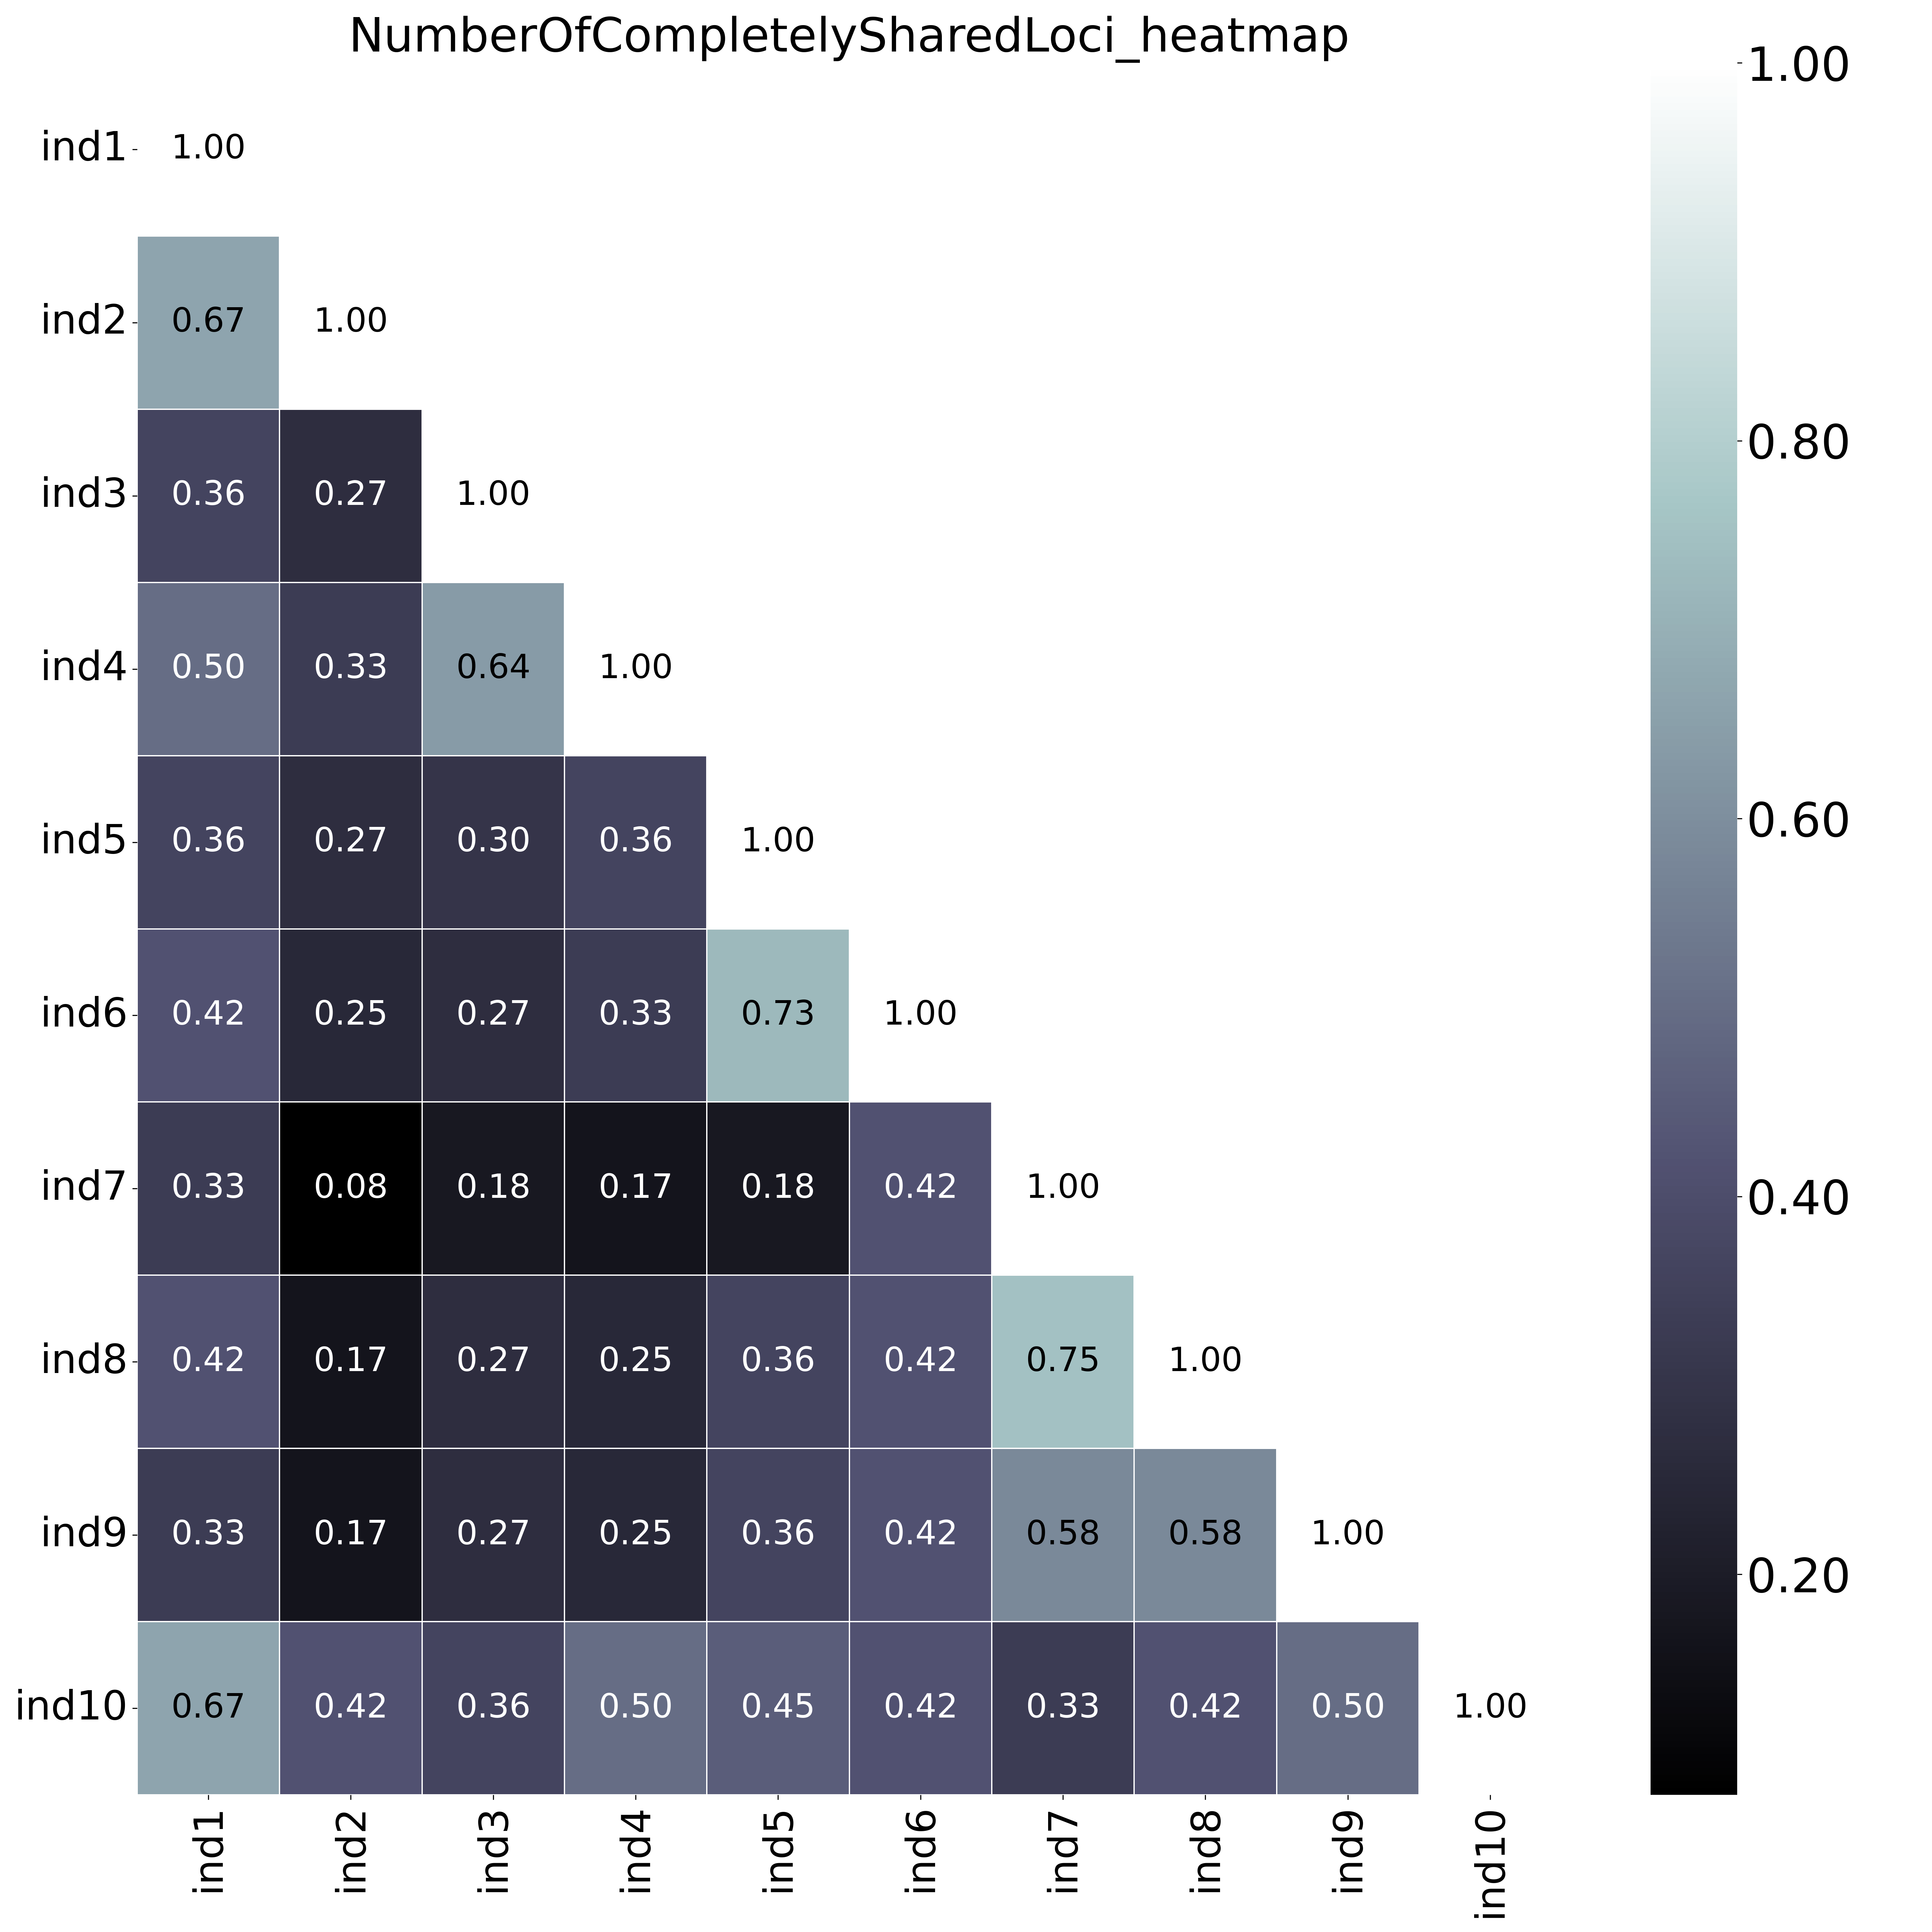 The font name and size of different elements in the graphs are changed with options
--font,--title_fontsize,--label_fontsize,--tick_fontsize, and--legend_fontsize. The legend position and resolution of the plot are adjusted with the options--legend_positionand--plot_resolution. Customize the colour scale in the matrices with the option--colour_map. Use option--maskto mask one half of the matrix (either all elements above the main diagonal or all elements below the main diagonal).This table (NumberOfSharedLoci.txt) shows the number of loci with data in both samples per pair.
ind1
ind2
ind3
ind4
ind5
ind6
ind7
ind8
ind9
ind10
ind1
12
ind2
12
12
ind3
11
11
11
ind4
12
12
11
12
ind5
11
11
10
11
11
ind6
12
12
11
12
11
12
ind7
12
12
11
12
11
12
12
ind8
12
12
11
12
11
12
12
12
ind9
12
12
11
12
11
12
12
12
12
ind10
12
12
11
12
11
12
12
12
12
12
This table (CompletelySharedLoci.txt) shows a list of all loci included in the analyses, the total number of sample pairs for which the loci were considered, the number of sample pairs for which the loci were informative (contain Complete Shared haplotypes), and the proportion of sample pairs for which the loci were informative.
Locus_ID
NumberOfComparisons
NumberOfComparisonsWithSharedLocus
ProportionOfComparisonsWithSharedLocus
locus1
36
7
0.19
locus2
45
5
0.11
locus3
45
14
0.31
locus4
45
29
0.64
locus5
45
15
0.33
locus6
36
18
0.5
locus7
45
29
0.64
locus8
45
9
0.2
locus9
45
16
0.36
locus10
45
8
0.18
locus11
45
36
0.8
locus12
45
13
0.29
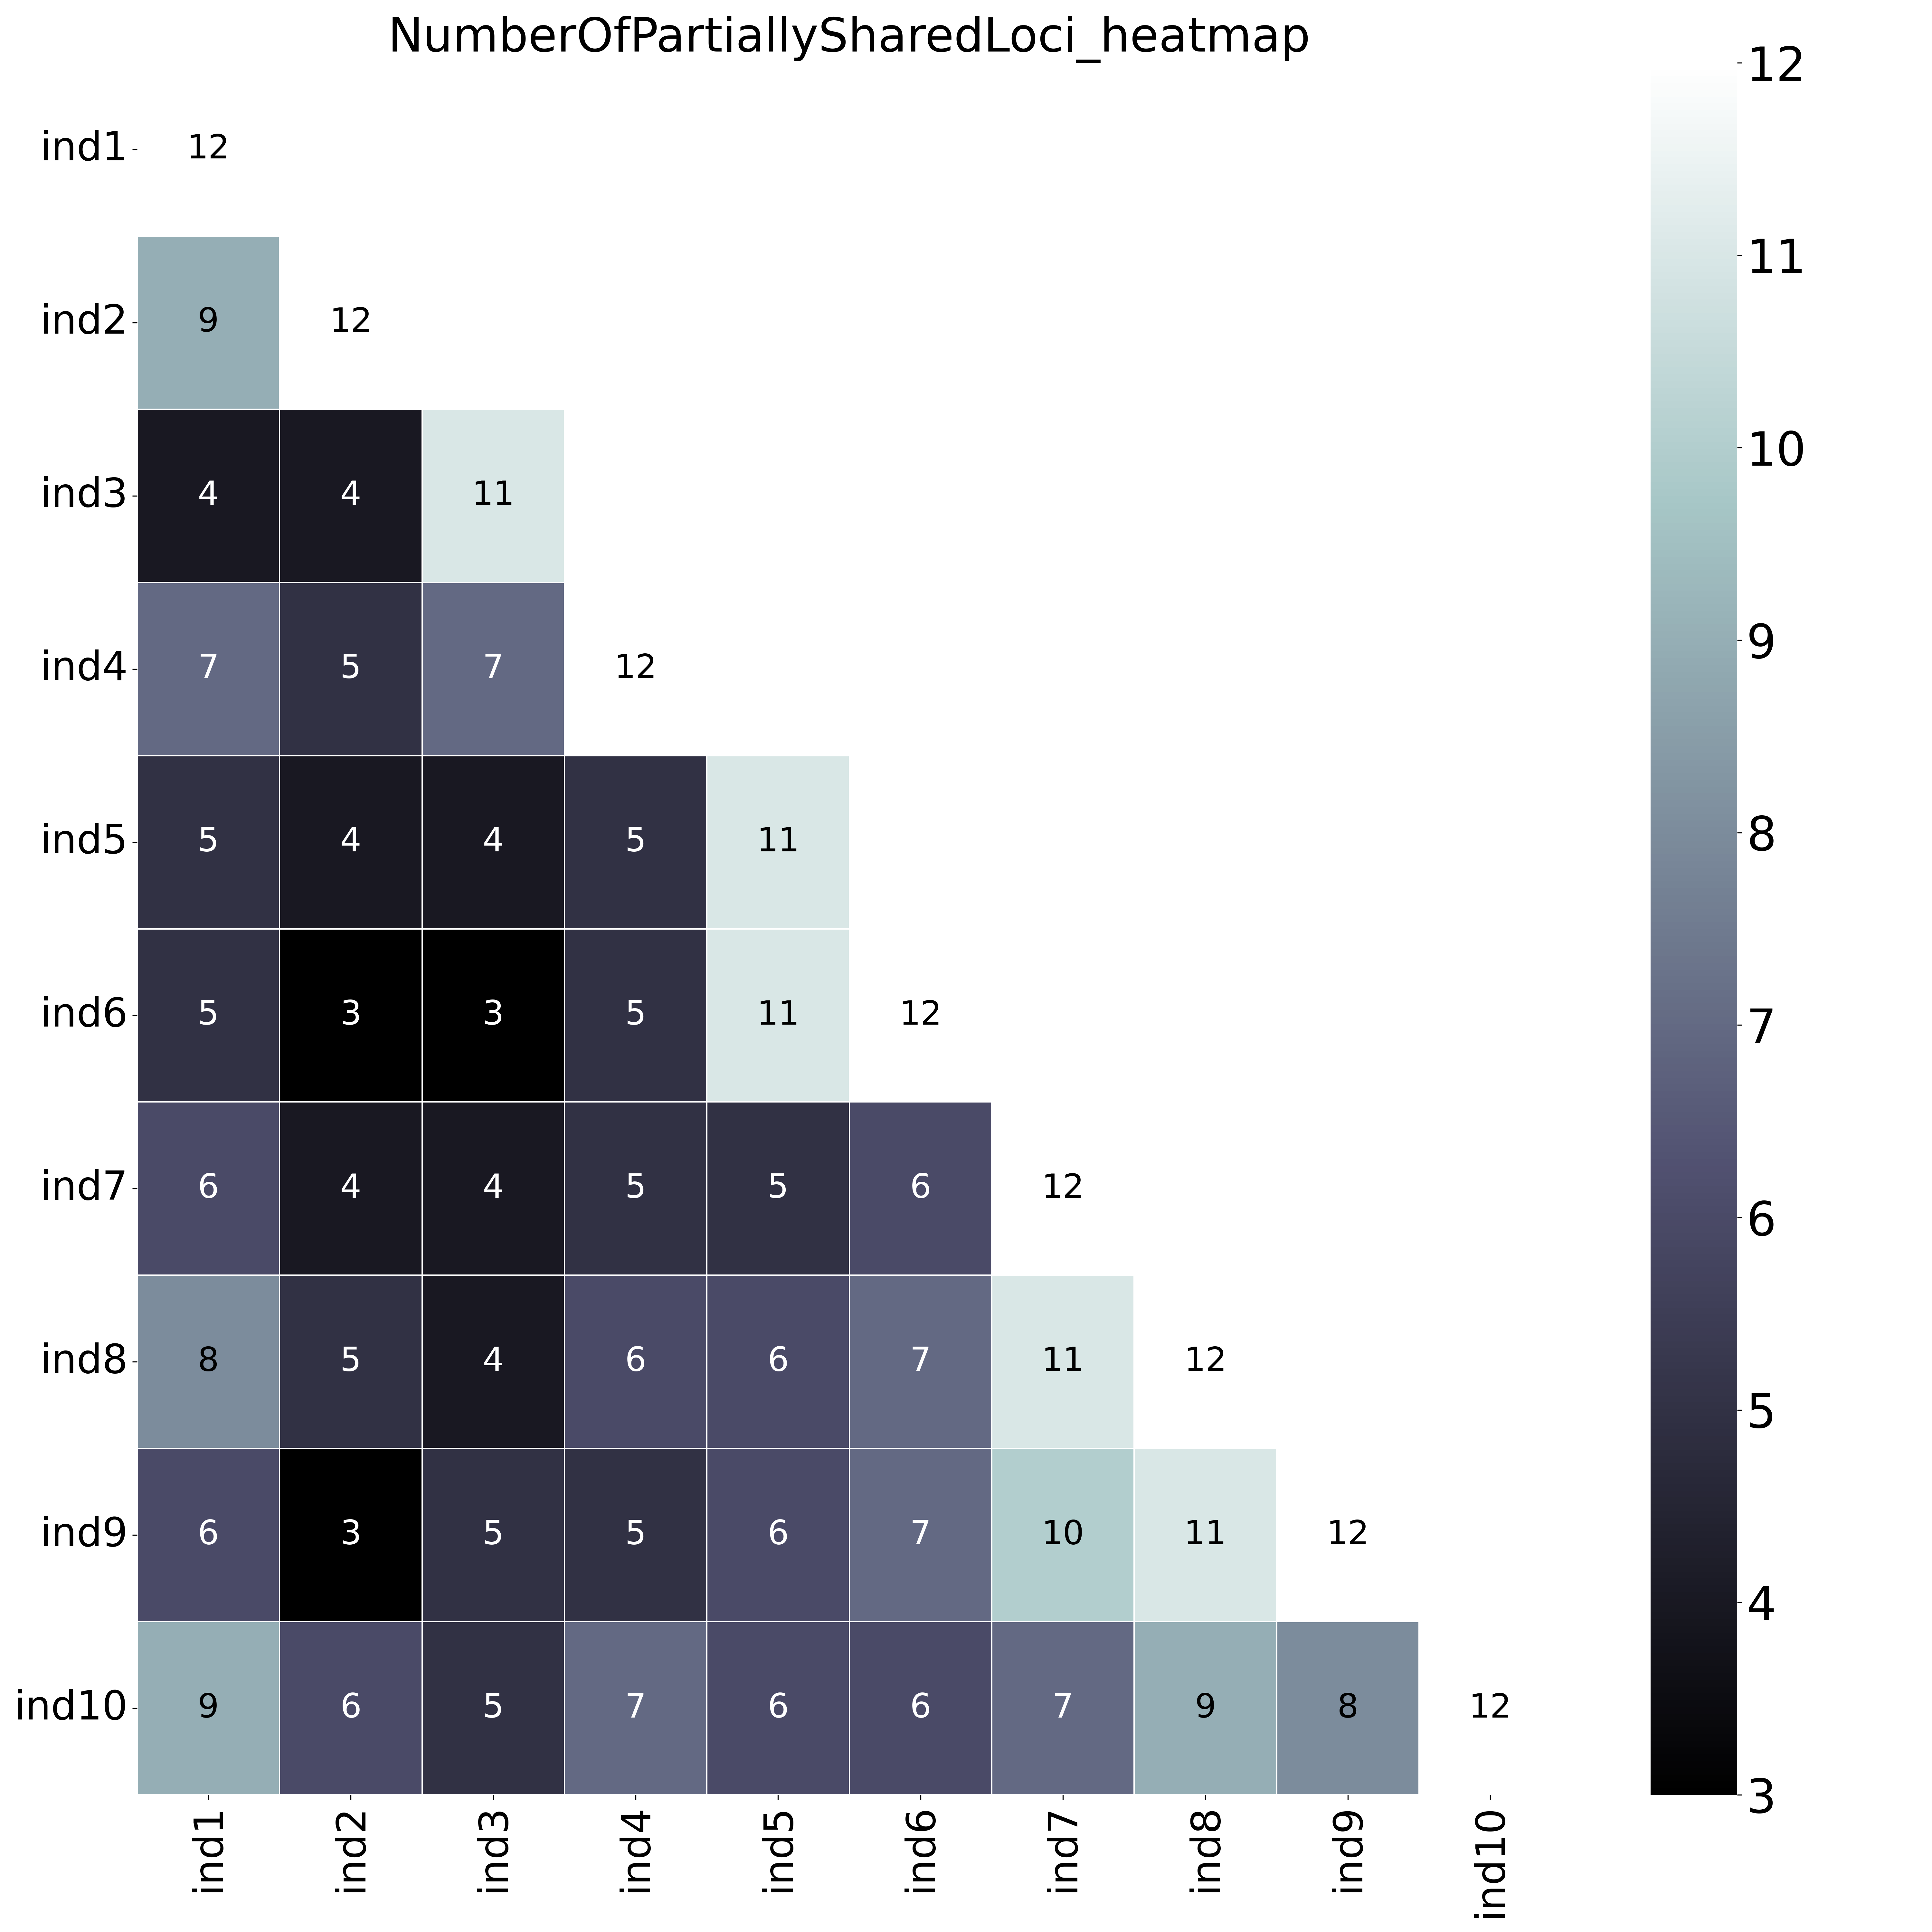
Loci with Partial Shared haplotypes
To illustrate the different kinds of analyses that can be performed, a simulated haplotype call matrix was created that includes various scenarios of shared and unique haplotype calls across a small sample set.
--locus_information_criterion shared (which creates a matrix showing the number of loci with Shared haplotypes in each comparison e.g. locus5 in ind7 uniquely has haplotype d) and loci that share at least one haplotype are counted (--partial).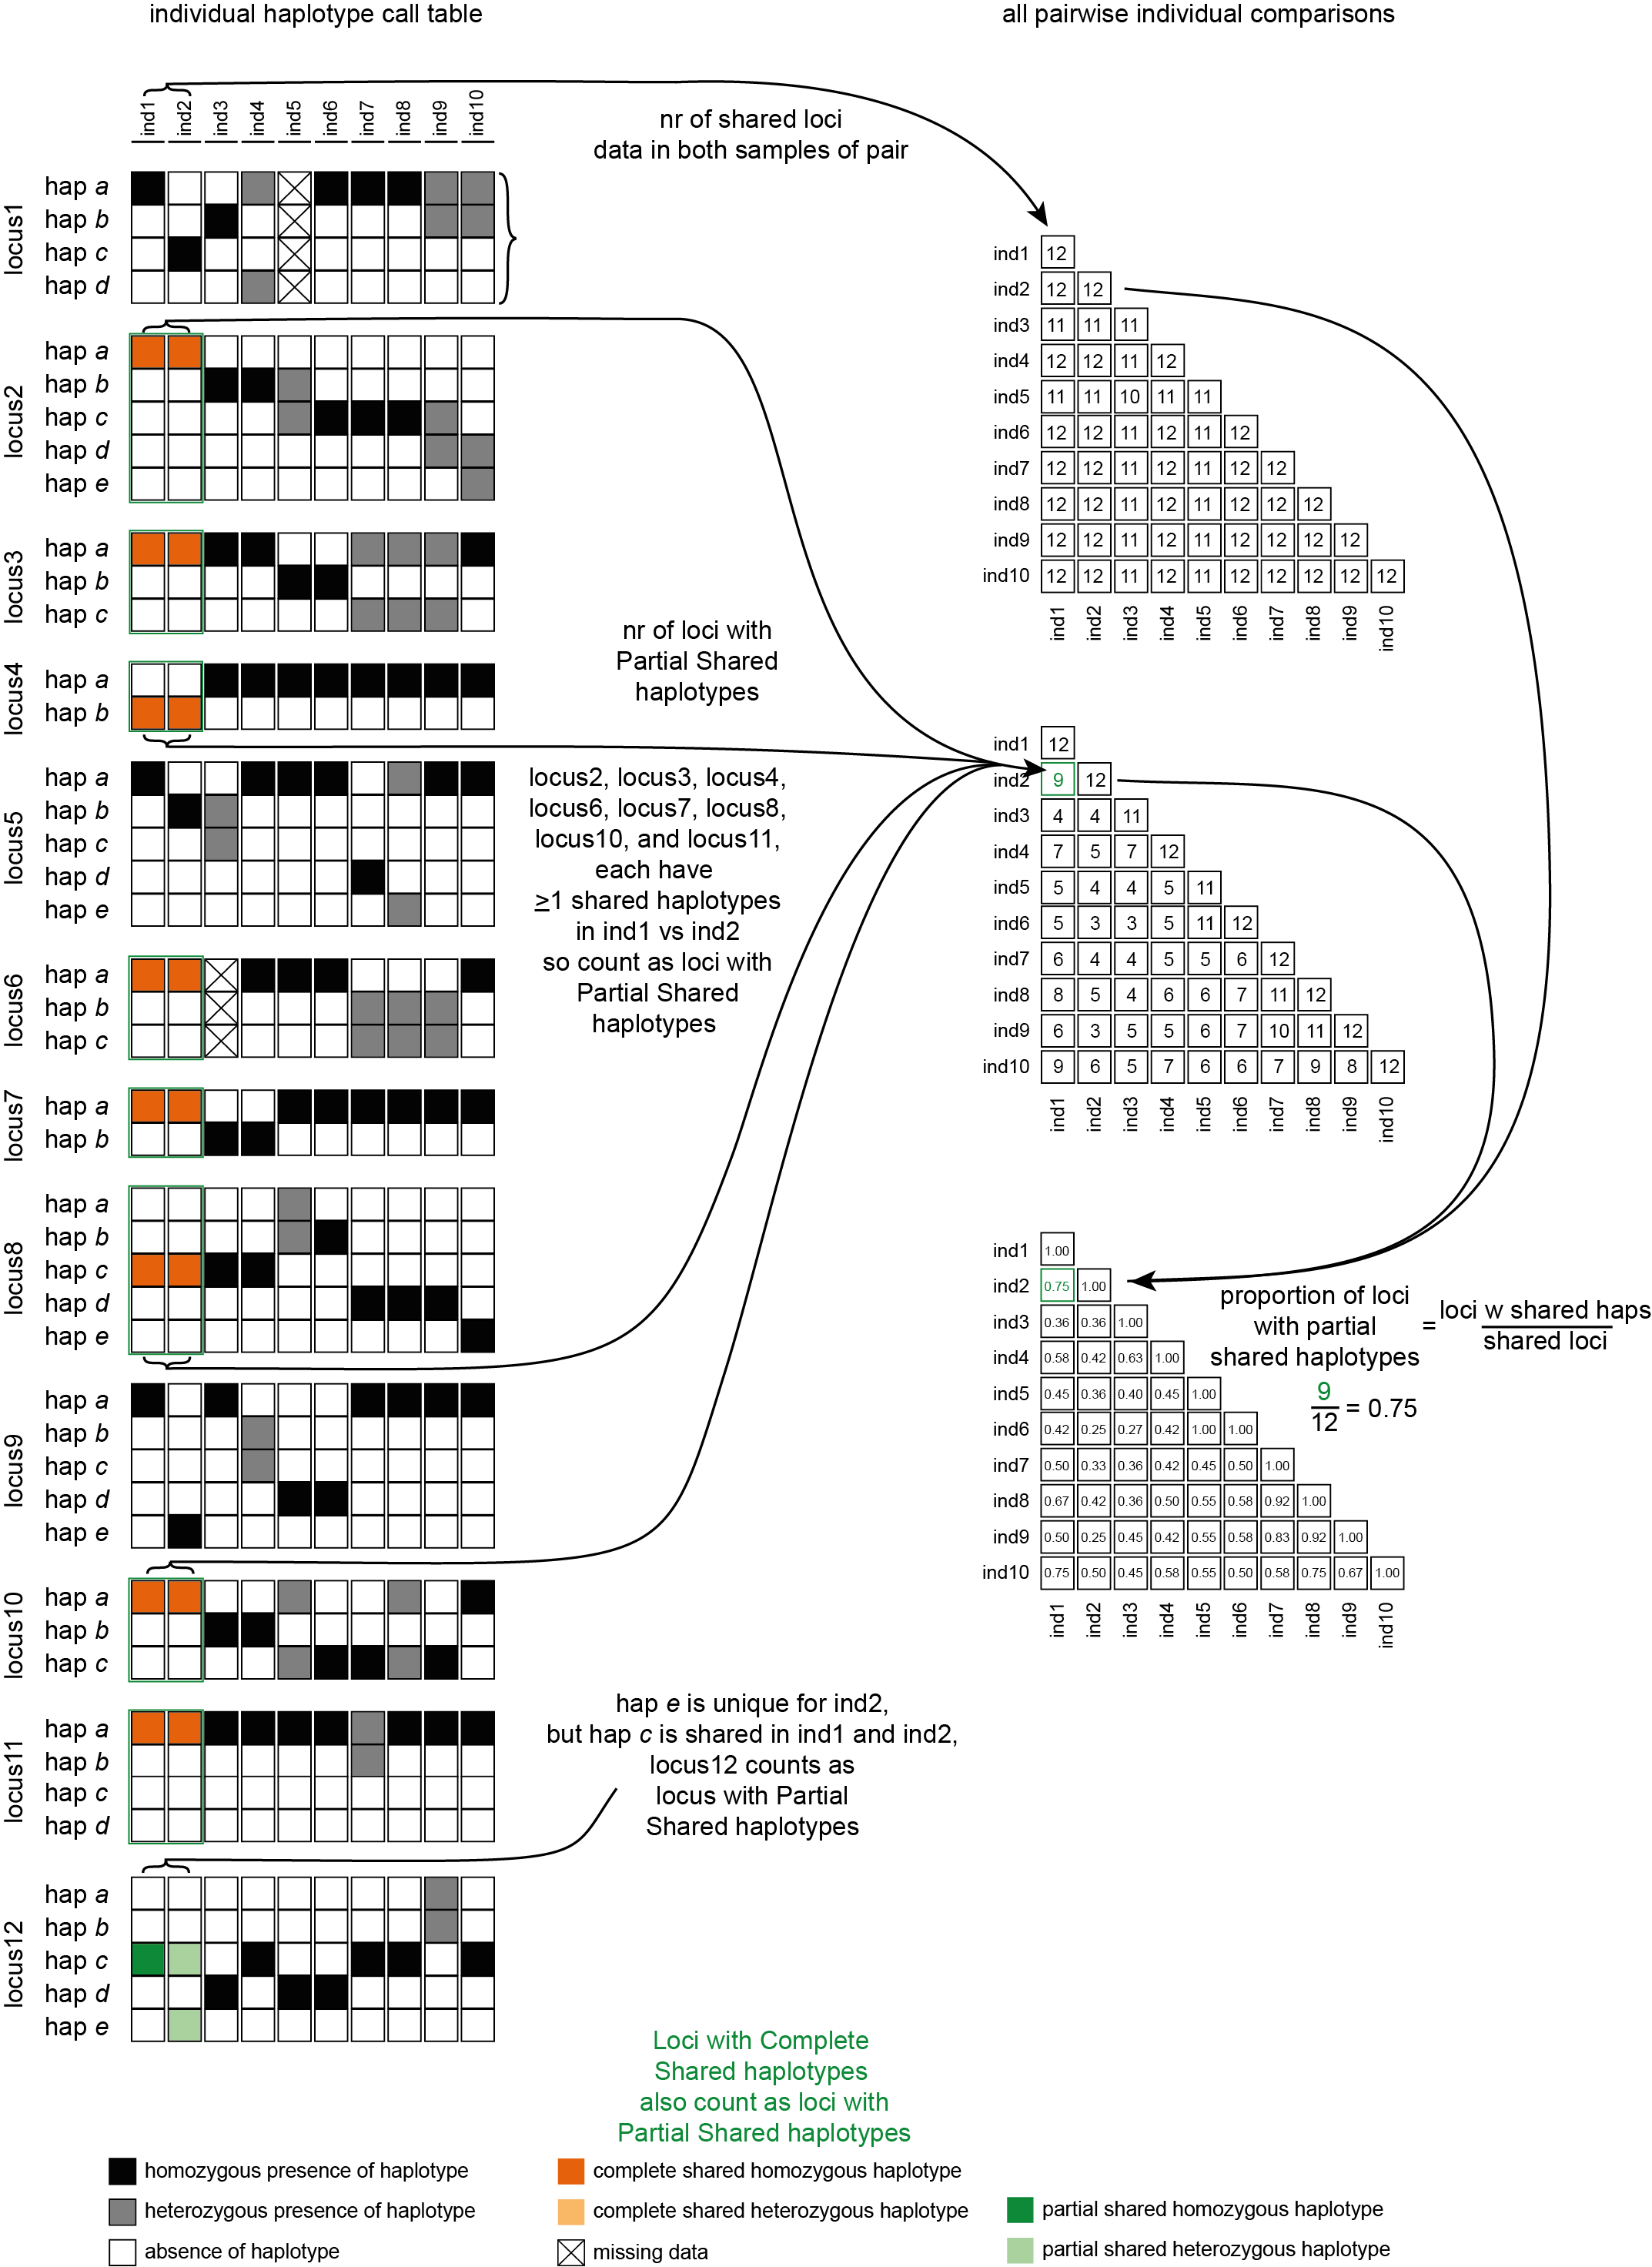
--locus_information_criterion unique.This table (NumberOfPartiallySharedLoci.txt) shows the (absolute) number of loci with Partial Shared haplotypes per sample pair, in a matrix of all pairwise comparisons.
ind1
ind2
ind3
ind4
ind5
ind6
ind7
ind8
ind9
ind10
ind1
12
ind2
9
12
ind3
4
4
11
ind4
7
5
7
12
ind5
5
4
4
5
11
ind6
5
3
3
5
11
12
ind7
6
4
4
5
5
6
12
ind8
8
5
4
6
6
7
11
12
ind9
6
3
5
5
6
7
10
11
12
ind10
9
6
5
7
6
6
7
9
8
12
With option--proportion_informative_loci, table (ProportionOfPartiallySharedLoci.txt) lists the proportion of the number of shared loci per sample pair (loci with data in both samples).
ind1
ind2
ind3
ind4
ind5
ind6
ind7
ind8
ind9
ind10
ind1
1.0
ind2
0.75
1.0
ind3
0.36363636363636365
0.36363636363636365
1.0
ind4
0.5833333333333334
0.4166666666666667
0.6363636363636364
1.0
ind5
0.45454545454545453
0.36363636363636365
0.4
0.45454545454545453
1.0
ind6
0.4166666666666667
0.25
0.2727272727272727
0.4166666666666667
1.0
1.0
ind7
0.5
0.3333333333333333
0.36363636363636365
0.4166666666666667
0.45454545454545453
0.5
1.0
ind8
0.6666666666666666
0.4166666666666667
0.36363636363636365
0.5
0.5454545454545454
0.5833333333333334
0.9166666666666666
1.0
ind9
0.5
0.25
0.45454545454545453
0.4166666666666667
0.5454545454545454
0.5833333333333334
0.8333333333333334
0.9166666666666666
1.0
ind10
0.75
0.5
0.45454545454545453
0.5833333333333334
0.5454545454545454
0.5
0.5833333333333334
0.75
0.6666666666666666
1.0
 With option
--proportion_informative_loci, the heatmap shows the proportion of the number of shared loci per sample pair (loci with data in both samples).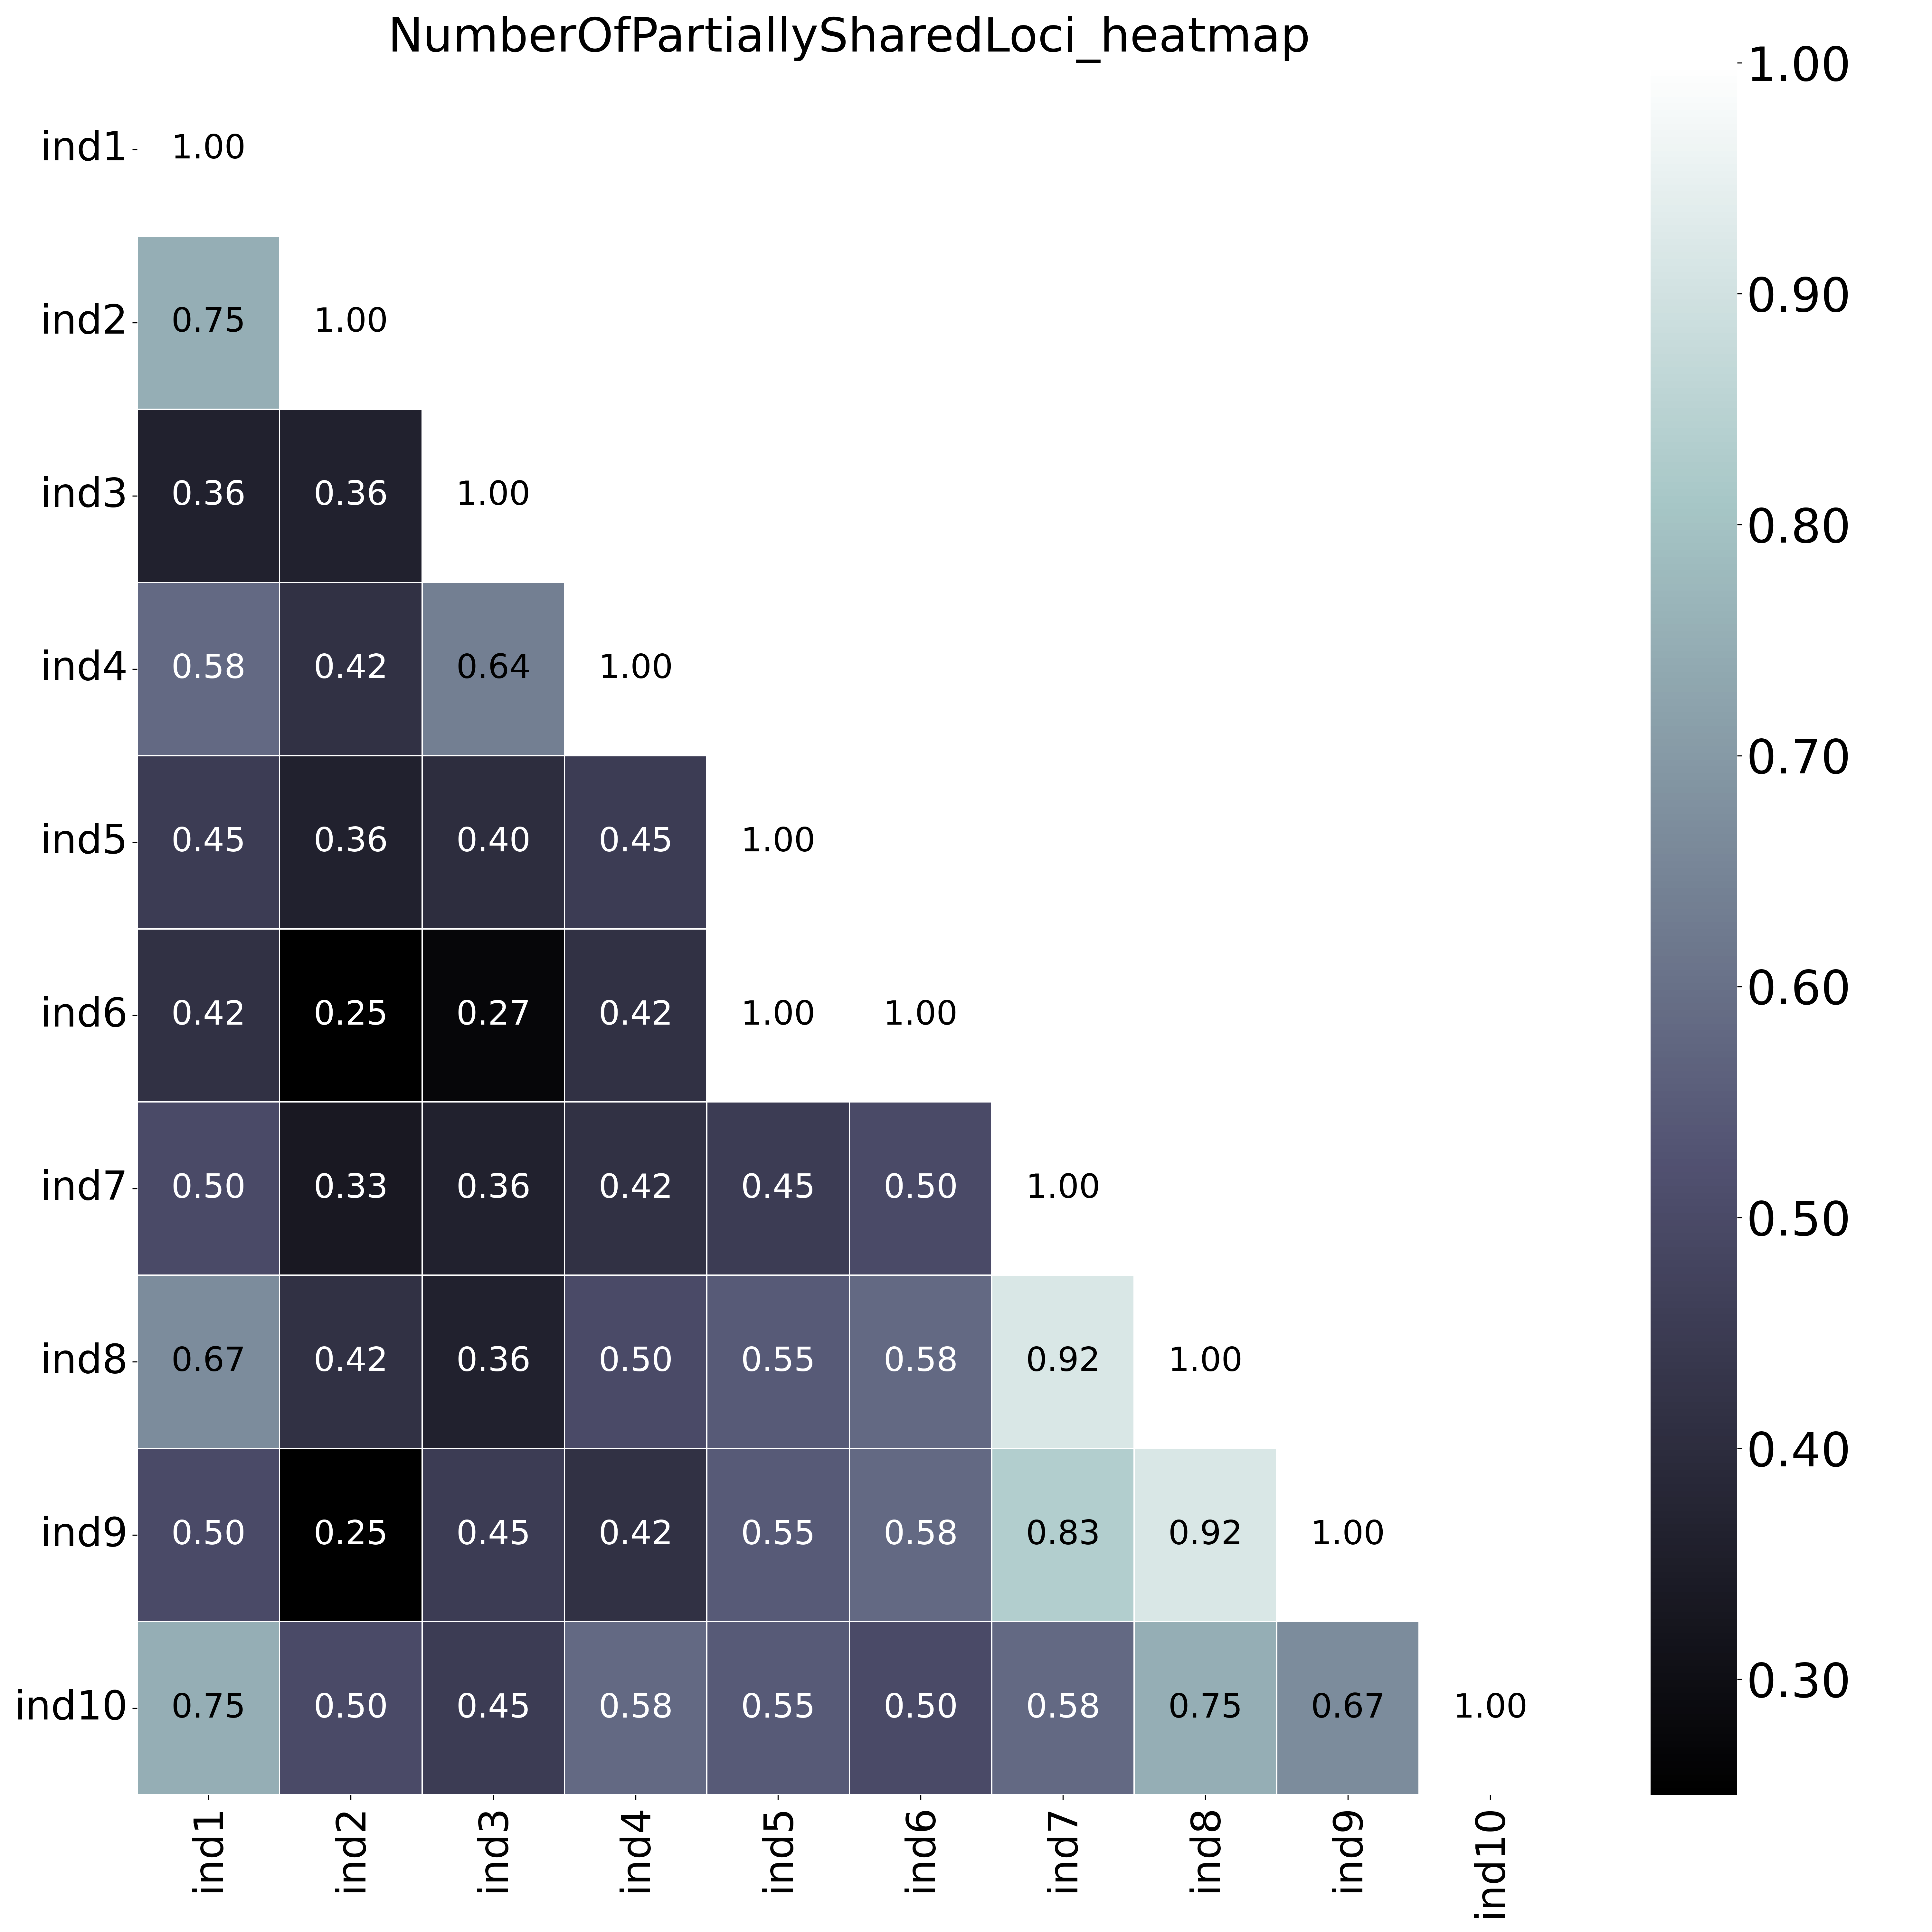 The font name and size of different elements in the graphs are changed with options
--font,--title_fontsize,--label_fontsize,--tick_fontsize, and--legend_fontsize. The legend position and resolution of the plot are adjusted with the options--legend_positionand--plot_resolution. Customize the colour scale in the matrices with the option--colour_map. Use option--maskto mask one half of the matrix (either all elements above the main diagonal or all elements below the main diagonal).This table (NumberOfSharedLoci.txt) shows the number of loci with data in both samples per pair.
ind1
ind2
ind3
ind4
ind5
ind6
ind7
ind8
ind9
ind10
ind1
12
ind2
12
12
ind3
11
11
11
ind4
12
12
11
12
ind5
11
11
10
11
11
ind6
12
12
11
12
11
12
ind7
12
12
11
12
11
12
12
ind8
12
12
11
12
11
12
12
12
ind9
12
12
11
12
11
12
12
12
12
ind10
12
12
11
12
11
12
12
12
12
12
This table (PartiallySharedLoci.txt) shows a list of all loci included in the analyses, the total number of sample pairs for which the loci were considered, the number of sample pairs for which the loci were informative (contain Partial Shared haplotypes), and the proportion of sample pairs for which the loci were informative.
Locus_ID
NumberOfComparisons
NumberOfComparisonsWithSharedLocus
ProportionOfComparisonsWithSharedLocus
locus1
36
23
0.64
locus2
45
15
0.33
locus3
45
29
0.64
locus4
45
29
0.64
locus5
45
22
0.49
locus6
36
18
0.5
locus7
45
29
0.64
locus8
45
10
0.22
locus9
45
16
0.36
locus10
45
20
0.44
locus11
45
45
1.0
locus12
45
18
0.4