Examples
Illustration of haplotyping with SMAP haplotype-sites
Below, we present good quality data sets analysed with SMAP haplotype-sites to illustrate typically expected haplotyping results. For each data set, the command to run SMAP haplotype-sites with suggested optimal settings, together with graphical results are displayed for comparison to your own data.
Please note that while we suggest ‘optimal’ parameter settings in the command to run SMAP haplotype-sites, the default of SMAP haplotype-sites is to perform as little filtering as possible and to report all loci. The user is adviced to run SMAP haplotype-sites first with the mandatory and default settings (no data filtered out), and then decide on the most optimal parameter settings for your own data. Parameter settings should be iteratively adjusted for each novel data set, after manual inspection of the graphical output. The example data shown below are merely meant to illustrate the expected outcome of data sets processed with parameters adjusted to the specific type of library, reads and samples. If your data does not look like these examples, please check out the section Recommendations and Troubleshooting for examples (and suggested solutions) of incorrectly generated, preprocessed, or mapped reads, or sample sets analyzed with inappropriate parameter settings for SMAP haplotype-sites. There, some guidelines for troubleshooting are provided, which may help to optimize library preparation, sequencing, read preprocessing or SMAP haplotype-sites parameter settings.
HiPlex
Individuals
smap haplotype-sites /directory/with/BAMs/ -mapping_orientation stranded -p 8 --plot all --plot_type png --name 2n_ind_GBS-SE -f 50 -g 200 --min_stack_depth 3 --max_stack_depth 500 --min_cluster_depth 10 --max_cluster_depth 1500 --max_stack_number 2 --min_stack_depth_fraction 10 --completeness 1 --max_smap_number 10SMAP haplotype-sites run with
--plot allplots the haplotype frequency distribution per sample. If discrete haplotype calling is performed, the frequency interval borders are also shown on the graph to check that individuals indeed show a haplotype frequency distribution according to expectation.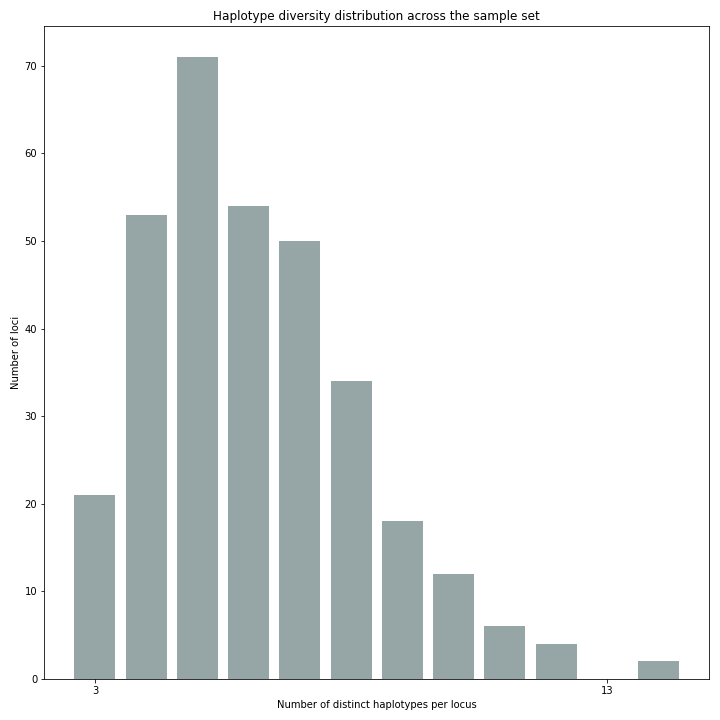
In diploid individuals, three peaks are expected: one below around 10% (noise) and one above around 90% (the major homozygous allele, but some data is lost to noise), and an intermediary peak around 50% to show heterozygous loci. See section on InDels.
_________________________________________________________________________________________________
SMAP haplotype-sites run with
--discrete_callingplots the sample correctness and completeness scores.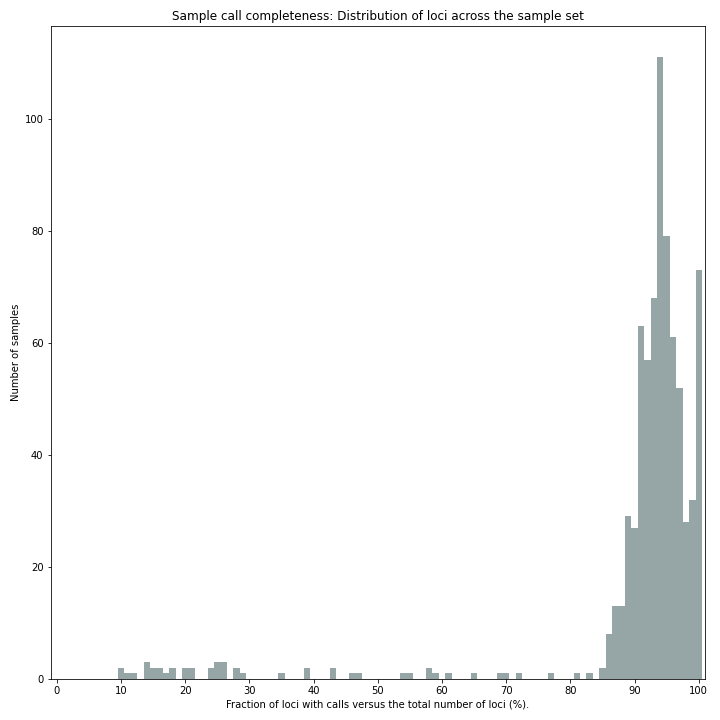
Sample completeness scores shows the distribution of the number of loci detected versus the total number of loci screened.
_________________________________________________________________________________________________
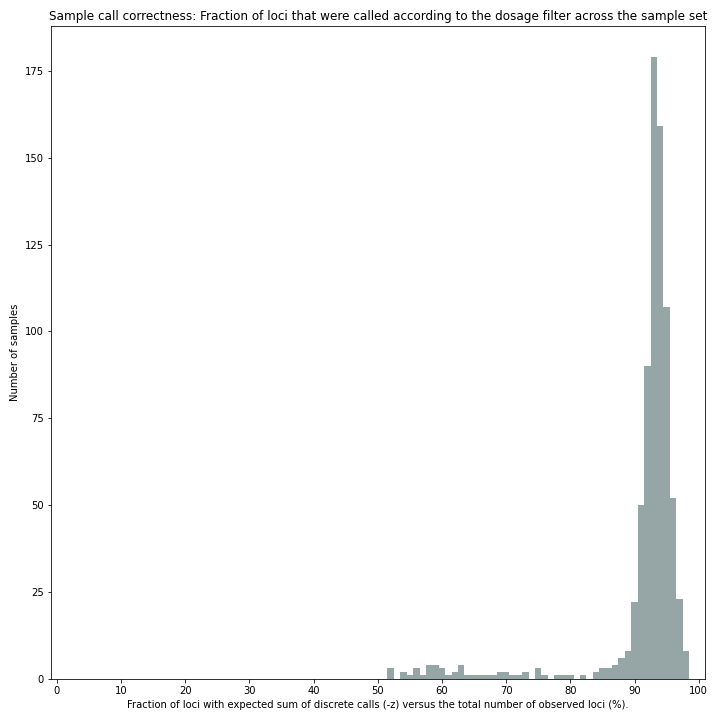
Sample correctness scores shows the distribution of the number of loci correctly called versus the total number of loci detected.
SMAP haplotype-sites run with
--discrete_callingplots the sample correctness and completeness scores. _________________________________________________________________________________________________Locus completeness scores shows the distribution of the number of samples detected versus the total number of samples screened per locus.
_________________________________________________________________________________________________
Locus correctness scores shows the distribution of the number of samples correctly called versus the total number of samples detected.
_________________________________________________________________________________________________
The haplotype diversity plot show the number of haplotypes per locus. Two plots are created, one directly after haplotype calling and one after filtering if discrete haplotype calling is performed.
Before filtering:
After filtering:
The reduction in the number of haplotypes per locus shows how effective the current parameter settings are for removing noise. The user can evaluate whether the parameter settings are too stringent or too permissive, by running SMAP haplotype-sites several times with different parameter settings and comparing the haplotype diversity and sample and locus completeness and correctess plots.
_________________________________________________________________________________________________
smap haplotype-sites /directory/with/BAMs/ -mapping_orientation stranded -p 8 --plot all --plot_type png --name 2n_ind_GBS-SE -f 50 -g 200 --min_stack_depth 3 --max_stack_depth 500 --min_cluster_depth 10 --max_cluster_depth 1500 --max_stack_number 2 --min_stack_depth_fraction 10 --completeness 1 --max_smap_number 10SMAP haplotype-sites run with
--plot allplots the haplotype frequency distribution per sample. If discrete haplotype calling is performed, the frequency interval borders are also shown on the graph to check that individuals indeed show a haplotype frequency distribution according to expectation.In diploid individuals, three peaks are expected: one below around 10% (noise) and one above around 90% (the major homozygous allele, but some data is lost to noise), and an intermediary peak around 50% to show heterozygous loci. See section on InDels.
_________________________________________________________________________________________________
SMAP haplotype-sites run with
--discrete_callingplots the sample correctness and completeness scores.Sample completeness scores shows the distribution of the number of loci detected versus the total number of loci screened.
_________________________________________________________________________________________________
Sample correctness scores shows the distribution of the number of loci correctly called versus the total number of loci detected.
SMAP haplotype-sites run with
--discrete_callingplots the sample correctness and completeness scores. _________________________________________________________________________________________________Locus completeness scores shows the distribution of the number of samples detected versus the total number of samples screened per locus.
_________________________________________________________________________________________________
Locus correctness scores shows the distribution of the number of samples correctly called versus the total number of samples detected.
_________________________________________________________________________________________________
The haplotype diversity plot show the number of haplotypes per locus. Two plots are created, one directly after haplotype calling and one after filtering if discrete haplotype calling is performed.
Before filtering:
After filtering:
The reduction in the number of haplotypes per locus shows how effective the current parameter settings are for removing noise. The user can evaluate whether the parameter settings are too stringent or too permissive, by running SMAP haplotype-sites several times with different parameter settings and comparing the haplotype diversity and sample and locus completeness and correctess plots.
_________________________________________________________________________________________________
Pools
smap haplotype-sites /directory/with/BAMs/ -mapping_orientation stranded -p 8 --plot all --plot_type png --name 2n_ind_GBS-SE -f 50 -g 200 --min_stack_depth 3 --max_stack_depth 500 --min_cluster_depth 10 --max_cluster_depth 1500 --max_stack_number 2 --min_stack_depth_fraction 10 --completeness 1 --max_smap_number 10SMAP haplotype-sites run with
--plot allplots the haplotype frequency distribution per sample. If discrete haplotype calling is performed, the frequency interval borders are also shown on the graph to check that individuals indeed show a haplotype frequency distribution according to expectation.In diploid individuals, three peaks are expected: one below around 10% (noise) and one above around 90% (the major homozygous allele, but some data is lost to noise), and an intermediary peak around 50% to show heterozygous loci. See section on InDels.
_________________________________________________________________________________________________
The haplotype diversity plot show the number of haplotypes per locus. Two plots are created, one directly after haplotype calling and one after filtering if discrete haplotype calling is performed.
Before filtering:
After filtering:
The reduction in the number of haplotypes per locus shows how effective the current parameter settings are for removing noise. The user can evaluate whether the parameter settings are too stringent or too permissive, by running SMAP haplotype-sites several times with different parameter settings and comparing the haplotype diversity and sample and locus completeness and correctess plots.
_________________________________________________________________________________________________
Shotgun
Sliding frames
smap haplotype-sites /directory/with/BAMs/ -mapping_orientation stranded -p 8 --plot all --plot_type png --name 2n_ind_GBS-SE -f 50 -g 200 --min_stack_depth 3 --max_stack_depth 500 --min_cluster_depth 10 --max_cluster_depth 1500 --max_stack_number 2 --min_stack_depth_fraction 10 --completeness 1 --max_smap_number 10SMAP haplotype-sites run with
--plot allplots the haplotype frequency distribution per sample. If discrete haplotype calling is performed, the frequency interval borders are also shown on the graph to check that individuals indeed show a haplotype frequency distribution according to expectation.In diploid individuals, three peaks are expected: one below around 10% (noise) and one above around 90% (the major homozygous allele, but some data is lost to noise), and an intermediary peak around 50% to show heterozygous loci. See section on InDels.
_________________________________________________________________________________________________
SMAP haplotype-sites run with
--discrete_callingplots the sample correctness and completeness scores.Sample completeness scores shows the distribution of the number of loci detected versus the total number of loci screened.
_________________________________________________________________________________________________
Sample correctness scores shows the distribution of the number of loci correctly called versus the total number of loci detected.
SMAP haplotype-sites run with
--discrete_callingplots the sample correctness and completeness scores. _________________________________________________________________________________________________Locus completeness scores shows the distribution of the number of samples detected versus the total number of samples screened per locus.
_________________________________________________________________________________________________
Locus correctness scores shows the distribution of the number of samples correctly called versus the total number of samples detected.
_________________________________________________________________________________________________
The haplotype diversity plot show the number of haplotypes per locus. Two plots are created, one directly after haplotype calling and one after filtering if discrete haplotype calling is performed.
Before filtering:
After filtering:
The reduction in the number of haplotypes per locus shows how effective the current parameter settings are for removing noise. The user can evaluate whether the parameter settings are too stringent or too permissive, by running SMAP haplotype-sites several times with different parameter settings and comparing the haplotype diversity and sample and locus completeness and correctess plots.
_________________________________________________________________________________________________
Structural Variants
smap haplotype-sites /directory/with/BAMs/ -mapping_orientation ignore -p 8 --plot all --plot_type png --name 2n_ind_GBS-SE -f 50 -g 200 --min_stack_depth 3 --max_stack_depth 500 --min_cluster_depth 10 --max_cluster_depth 1500 --max_stack_number 2 --min_stack_depth_fraction 10 --completeness 1 --max_smap_number 10SMAP haplotype-sites run with
--plot allplots the haplotype frequency distribution per sample. If discrete haplotype calling is performed, the frequency interval borders are also shown on the graph to check that individuals indeed show a haplotype frequency distribution according to expectation.In diploid individuals, three peaks are expected: one below around 10% (noise) and one above around 90% (the major homozygous allele, but some data is lost to noise), and an intermediary peak around 50% to show heterozygous loci. See section on InDels.
_________________________________________________________________________________________________
SMAP haplotype-sites run with
--discrete_callingplots the sample correctness and completeness scores.Sample completeness scores shows the distribution of the number of loci detected versus the total number of loci screened.
_________________________________________________________________________________________________
Sample correctness scores shows the distribution of the number of loci correctly called versus the total number of loci detected.
SMAP haplotype-sites run with
--discrete_callingplots the sample correctness and completeness scores. _________________________________________________________________________________________________Locus completeness scores shows the distribution of the number of samples detected versus the total number of samples screened per locus.
_________________________________________________________________________________________________
Locus correctness scores shows the distribution of the number of samples correctly called versus the total number of samples detected.
_________________________________________________________________________________________________
The haplotype diversity plot show the number of haplotypes per locus. Two plots are created, one directly after haplotype calling and one after filtering if discrete haplotype calling is performed.
Before filtering:
After filtering:
The reduction in the number of haplotypes per locus shows how effective the current parameter settings are for removing noise. The user can evaluate whether the parameter settings are too stringent or too permissive, by running SMAP haplotype-sites several times with different parameter settings and comparing the haplotype diversity and sample and locus completeness and correctess plots.
_________________________________________________________________________________________________
Oxford Nanopore long reads
smap haplotype-sites /directory/with/BAMs/ -mapping_orientation ignore -p 8 --plot all --plot_type png --name 2n_ind_GBS-SE -f 50 -g 200 --min_stack_depth 3 --max_stack_depth 500 --min_cluster_depth 10 --max_cluster_depth 1500 --max_stack_number 2 --min_stack_depth_fraction 10 --completeness 1 --max_smap_number 10SMAP haplotype-sites run with
--plot allplots the haplotype frequency distribution per sample. If discrete haplotype calling is performed, the frequency interval borders are also shown on the graph to check that individuals indeed show a haplotype frequency distribution according to expectation.In diploid individuals, three peaks are expected: one below around 10% (noise) and one above around 90% (the major homozygous allele, but some data is lost to noise), and an intermediary peak around 50% to show heterozygous loci. See section on InDels.
_________________________________________________________________________________________________
SMAP haplotype-sites run with
--discrete_callingplots the sample correctness and completeness scores.Sample completeness scores shows the distribution of the number of loci detected versus the total number of loci screened.
_________________________________________________________________________________________________
Sample correctness scores shows the distribution of the number of loci correctly called versus the total number of loci detected.
SMAP haplotype-sites run with
--discrete_callingplots the sample correctness and completeness scores. _________________________________________________________________________________________________Locus completeness scores shows the distribution of the number of samples detected versus the total number of samples screened per locus.
_________________________________________________________________________________________________
Locus correctness scores shows the distribution of the number of samples correctly called versus the total number of samples detected.
_________________________________________________________________________________________________
The haplotype diversity plot show the number of haplotypes per locus. Two plots are created, one directly after haplotype calling and one after filtering if discrete haplotype calling is performed.
Before filtering:
After filtering:
The reduction in the number of haplotypes per locus shows how effective the current parameter settings are for removing noise. The user can evaluate whether the parameter settings are too stringent or too permissive, by running SMAP haplotype-sites several times with different parameter settings and comparing the haplotype diversity and sample and locus completeness and correctess plots.
_________________________________________________________________________________________________
PacBio long reads
smap haplotype-sites /directory/with/BAMs/ -mapping_orientation ignore -p 8 --plot all --plot_type png --name 2n_ind_GBS-SE -f 50 -g 200 --min_stack_depth 3 --max_stack_depth 500 --min_cluster_depth 10 --max_cluster_depth 1500 --max_stack_number 2 --min_stack_depth_fraction 10 --completeness 1 --max_smap_number 10SMAP haplotype-sites run with
--plot allplots the haplotype frequency distribution per sample. If discrete haplotype calling is performed, the frequency interval borders are also shown on the graph to check that individuals indeed show a haplotype frequency distribution according to expectation.In diploid individuals, three peaks are expected: one below around 10% (noise) and one above around 90% (the major homozygous allele, but some data is lost to noise), and an intermediary peak around 50% to show heterozygous loci. See section on InDels.
_________________________________________________________________________________________________
SMAP haplotype-sites run with
--discrete_callingplots the sample correctness and completeness scores.Sample completeness scores shows the distribution of the number of loci detected versus the total number of loci screened.
_________________________________________________________________________________________________
Sample correctness scores shows the distribution of the number of loci correctly called versus the total number of loci detected.
SMAP haplotype-sites run with
--discrete_callingplots the sample correctness and completeness scores. _________________________________________________________________________________________________Locus completeness scores shows the distribution of the number of samples detected versus the total number of samples screened per locus.
_________________________________________________________________________________________________
Locus correctness scores shows the distribution of the number of samples correctly called versus the total number of samples detected.
_________________________________________________________________________________________________
The haplotype diversity plot show the number of haplotypes per locus. Two plots are created, one directly after haplotype calling and one after filtering if discrete haplotype calling is performed.
Before filtering:
After filtering:
The reduction in the number of haplotypes per locus shows how effective the current parameter settings are for removing noise. The user can evaluate whether the parameter settings are too stringent or too permissive, by running SMAP haplotype-sites several times with different parameter settings and comparing the haplotype diversity and sample and locus completeness and correctess plots.
_________________________________________________________________________________________________
GBS
Individuals
smap haplotype-sites /directory/with/BAMs/ -mapping_orientation ignore -p 8 --plot all --plot_type png --name 2n_ind_GBS-SE -f 50 -g 200 --min_stack_depth 3 --max_stack_depth 500 --min_cluster_depth 10 --max_cluster_depth 1500 --max_stack_number 2 --min_stack_depth_fraction 10 --completeness 1 --max_smap_number 10SMAP haplotype-sites run with
--plot allplots the haplotype frequency distribution per sample. If discrete haplotype calling is performed, the frequency interval borders are also shown on the graph to check that individuals indeed show a haplotype frequency distribution according to expectation.In diploid individuals, three peaks are expected: one below around 10% (noise) and one above around 90% (the major homozygous allele, but some data is lost to noise), and an intermediary peak around 50% to show heterozygous loci. See section on InDels.
_________________________________________________________________________________________________
SMAP haplotype-sites run with
--discrete_callingplots the sample correctness and completeness scores.Sample completeness scores shows the distribution of the number of loci detected versus the total number of loci screened.
_________________________________________________________________________________________________
Sample correctness scores shows the distribution of the number of loci correctly called versus the total number of loci detected.
SMAP haplotype-sites run with
--discrete_callingplots the sample correctness and completeness scores. _________________________________________________________________________________________________Locus completeness scores shows the distribution of the number of samples detected versus the total number of samples screened per locus.
_________________________________________________________________________________________________
Locus correctness scores shows the distribution of the number of samples correctly called versus the total number of samples detected.
_________________________________________________________________________________________________
The haplotype diversity plot show the number of haplotypes per locus. Two plots are created, one directly after haplotype calling and one after filtering if discrete haplotype calling is performed.
Before filtering:
After filtering:
The reduction in the number of haplotypes per locus shows how effective the current parameter settings are for removing noise. The user can evaluate whether the parameter settings are too stringent or too permissive, by running SMAP haplotype-sites several times with different parameter settings and comparing the haplotype diversity and sample and locus completeness and correctess plots.
_________________________________________________________________________________________________
smap haplotype-sites /directory/with/BAMs/ -mapping_orientation stranded -p 8 --plot all --plot_type png --name 2n_ind_GBS-SE -f 50 -g 200 --min_stack_depth 3 --max_stack_depth 500 --min_cluster_depth 10 --max_cluster_depth 1500 --max_stack_number 2 --min_stack_depth_fraction 10 --completeness 1 --max_smap_number 10SMAP haplotype-sites run with
--plot allplots the haplotype frequency distribution per sample. If discrete haplotype calling is performed, the frequency interval borders are also shown on the graph to check that individuals indeed show a haplotype frequency distribution according to expectation.In diploid individuals, three peaks are expected: one below around 10% (noise) and one above around 90% (the major homozygous allele, but some data is lost to noise), and an intermediary peak around 50% to show heterozygous loci. See section on InDels.
_________________________________________________________________________________________________
SMAP haplotype-sites run with
--discrete_callingplots the sample correctness and completeness scores.Sample completeness scores shows the distribution of the number of loci detected versus the total number of loci screened.
_________________________________________________________________________________________________
Sample correctness scores shows the distribution of the number of loci correctly called versus the total number of loci detected.
SMAP haplotype-sites run with
--discrete_callingplots the sample correctness and completeness scores. _________________________________________________________________________________________________Locus completeness scores shows the distribution of the number of samples detected versus the total number of samples screened per locus.
_________________________________________________________________________________________________
Locus correctness scores shows the distribution of the number of samples correctly called versus the total number of samples detected.
_________________________________________________________________________________________________
The haplotype diversity plot show the number of haplotypes per locus. Two plots are created, one directly after haplotype calling and one after filtering if discrete haplotype calling is performed.
Before filtering:
After filtering:
The reduction in the number of haplotypes per locus shows how effective the current parameter settings are for removing noise. The user can evaluate whether the parameter settings are too stringent or too permissive, by running SMAP haplotype-sites several times with different parameter settings and comparing the haplotype diversity and sample and locus completeness and correctess plots.
_________________________________________________________________________________________________
smap haplotype-sites /directory/with/BAMs/ -mapping_orientation ignore -p 8 --plot all --plot_type png --name 2n_ind_GBS-SE -f 50 -g 200 --min_stack_depth 3 --max_stack_depth 500 --min_cluster_depth 10 --max_cluster_depth 1500 --max_stack_number 2 --min_stack_depth_fraction 10 --completeness 1 --max_smap_number 10SMAP haplotype-sites run with
--plot allplots the haplotype frequency distribution per sample. If discrete haplotype calling is performed, the frequency interval borders are also shown on the graph to check that individuals indeed show a haplotype frequency distribution according to expectation.In diploid individuals, three peaks are expected: one below around 10% (noise) and one above around 90% (the major homozygous allele, but some data is lost to noise), and an intermediary peak around 50% to show heterozygous loci. See section on InDels.
_________________________________________________________________________________________________
SMAP haplotype-sites run with
--discrete_callingplots the sample correctness and completeness scores.Sample completeness scores shows the distribution of the number of loci detected versus the total number of loci screened.
_________________________________________________________________________________________________
Sample correctness scores shows the distribution of the number of loci correctly called versus the total number of loci detected.
SMAP haplotype-sites run with
--discrete_callingplots the sample correctness and completeness scores. _________________________________________________________________________________________________Locus completeness scores shows the distribution of the number of samples detected versus the total number of samples screened per locus.
_________________________________________________________________________________________________
Locus correctness scores shows the distribution of the number of samples correctly called versus the total number of samples detected.
_________________________________________________________________________________________________
The haplotype diversity plot show the number of haplotypes per locus. Two plots are created, one directly after haplotype calling and one after filtering if discrete haplotype calling is performed.
Before filtering:
After filtering:
The reduction in the number of haplotypes per locus shows how effective the current parameter settings are for removing noise. The user can evaluate whether the parameter settings are too stringent or too permissive, by running SMAP haplotype-sites several times with different parameter settings and comparing the haplotype diversity and sample and locus completeness and correctess plots.
_________________________________________________________________________________________________
Pools
smap haplotype-sites /directory/with/BAMs/ -mapping_orientation ignore -p 8 --plot all --plot_type png --name 2n_ind_GBS-SE -f 50 -g 200 --min_stack_depth 3 --max_stack_depth 500 --min_cluster_depth 10 --max_cluster_depth 1500 --max_stack_number 2 --min_stack_depth_fraction 10 --completeness 1 --max_smap_number 10SMAP haplotype-sites run with
--plot allplots the haplotype frequency distribution per sample. If discrete haplotype calling is performed, the frequency interval borders are also shown on the graph to check that individuals indeed show a haplotype frequency distribution according to expectation.In diploid individuals, three peaks are expected: one below around 10% (noise) and one above around 90% (the major homozygous allele, but some data is lost to noise), and an intermediary peak around 50% to show heterozygous loci. See section on InDels.
_________________________________________________________________________________________________
The haplotype diversity plot show the number of haplotypes per locus. Two plots are created, one directly after haplotype calling and one after filtering if discrete haplotype calling is performed.
Before filtering:
After filtering:
The reduction in the number of haplotypes per locus shows how effective the current parameter settings are for removing noise. The user can evaluate whether the parameter settings are too stringent or too permissive, by running SMAP haplotype-sites several times with different parameter settings and comparing the haplotype diversity and sample and locus completeness and correctess plots.
_________________________________________________________________________________________________